Subscribe to Our Blog
Receive updates from our team as we share application notes, customer spotlights, educational tools, spectroscopy how-to’s, and more.

In this tech tip, we offer suggestions for making sense of the sharp peaks and jagged shapes you’ll find in Raman spectra. Raman signatures can be used as is or matched to a known database for materials identification.
Once considered too advanced in theory and application for most users, Raman spectroscopy today encompasses instruments from simple handheld devices to more sophisticated benchtop systems, with Raman data analysis strategies ranging from careful application of a few key principles to more automated approaches using chemometrics and machine learning.
Raman peak signatures offer highly repeatable fingerprints for each analyte that can be deconvoluted via any number of numerical methods. This allows detection of complex mixtures and real-world samples that often are quite “messy” versus an idealized laboratory sample.
Although Raman is advanced as a spectral technique, it’s not difficult or overly complicated. What makes Raman tricky is that the things you care about are mixed in with a bunch of other spectral features. For example, in traditional spectroscopy, you can analyze a transmissive absorbance plot (i.e., dye in a cuvette) or a material reflection plot, and easily pick out broad humps and intersecting isosbestic points and explain them. But in Raman spectra, there’s just a seemingly random topography of spectral features.
Indeed, most users have observed Raman spectra that have peaks and jagged shapes everywhere. Where do these features come from? Well, they’re from all sorts of things: residual sample, pixel-to-pixel response, and more. It’s best to not overthink it, honestly. These are the key questions to ask:
Fortunately, there is a limited set of tools to run your data through.
This just means subtracting some pixel/wavenumber value from every other value, which pegs that one wavenumber to zero. This will correct for vertical offsets caused by issues with focus, power and so on, but will not scale the magnitude of the plot.
If you’re more familiar with spectroscopy modes such as absorbance or reflectance, you know it’s important to account for any optical shifts by performing a baseline correction. Peak values, or any values in general, may be skewed by some environmental influence but can be corrected based on region(s) known to be independent of changing parameters. The same can be done for Raman spectra, and is critical to correct if one wishes to quantify the data.
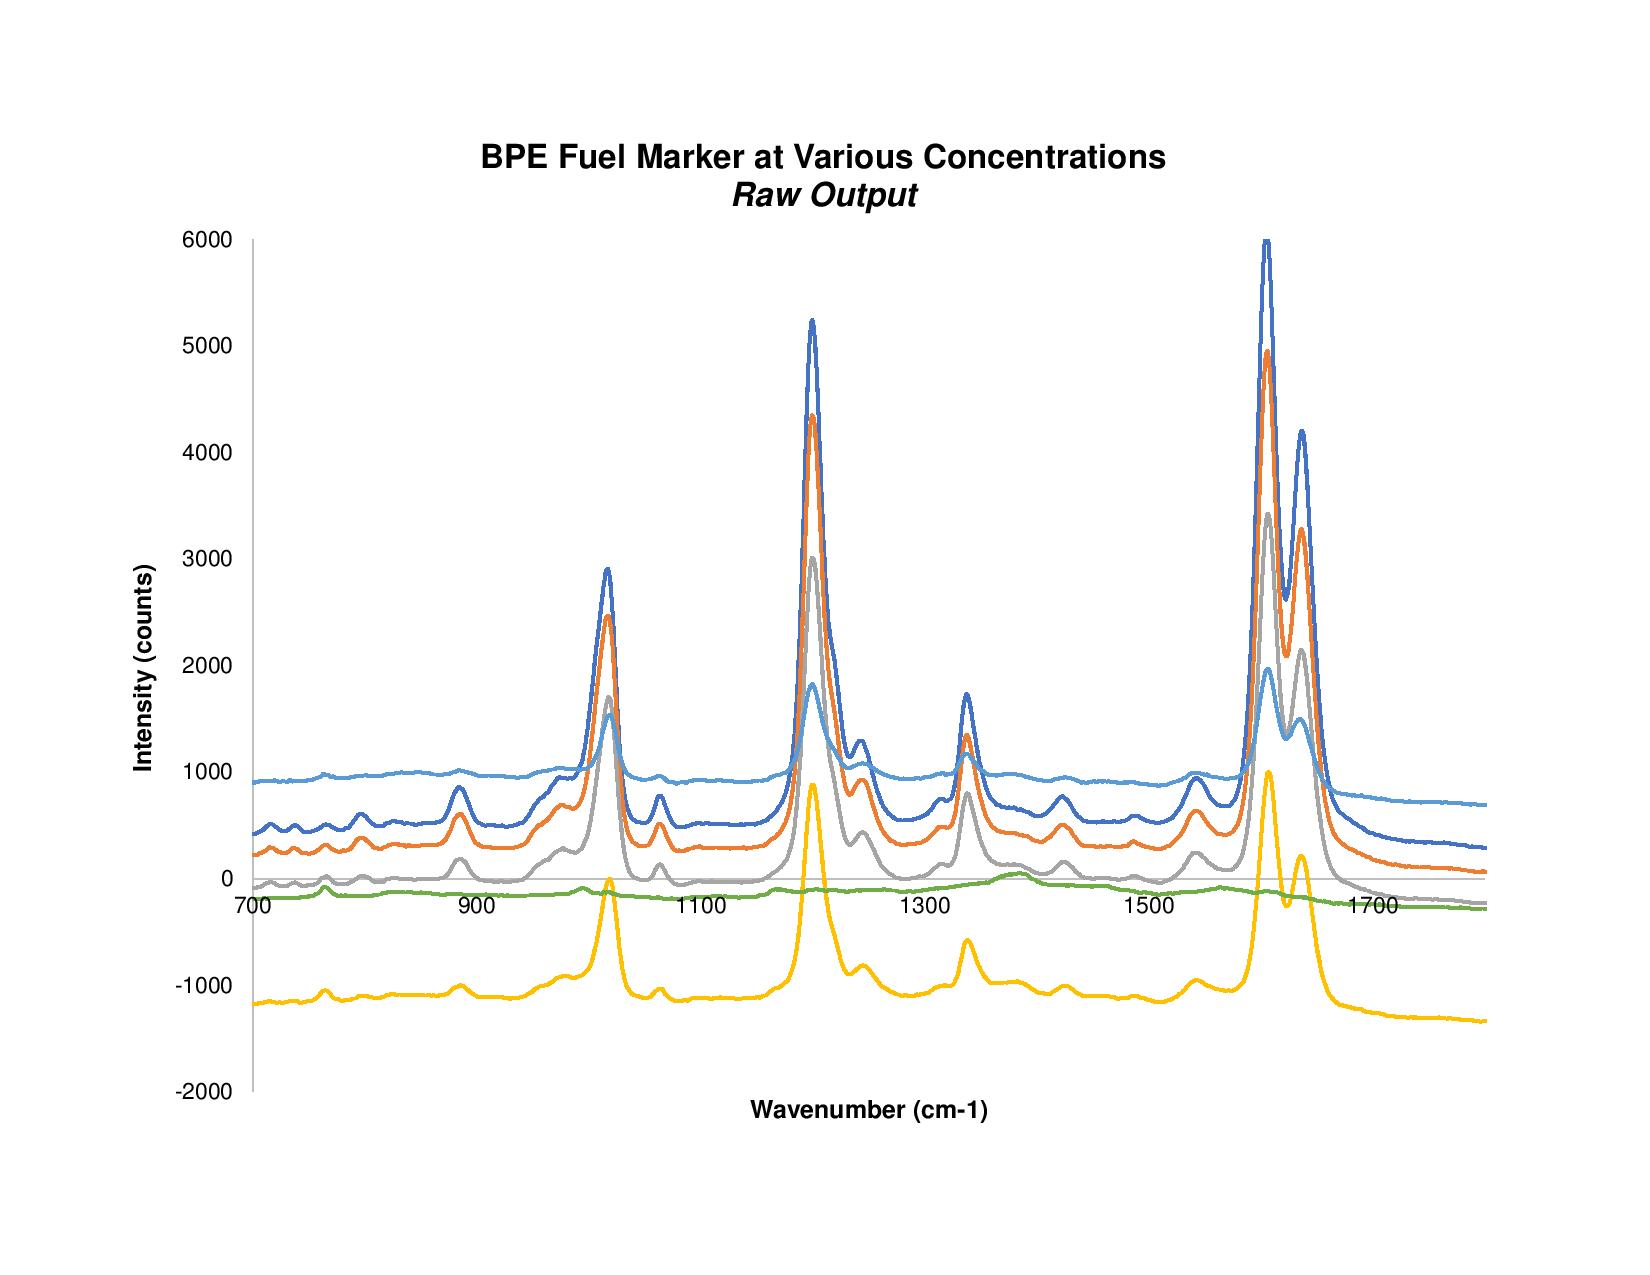
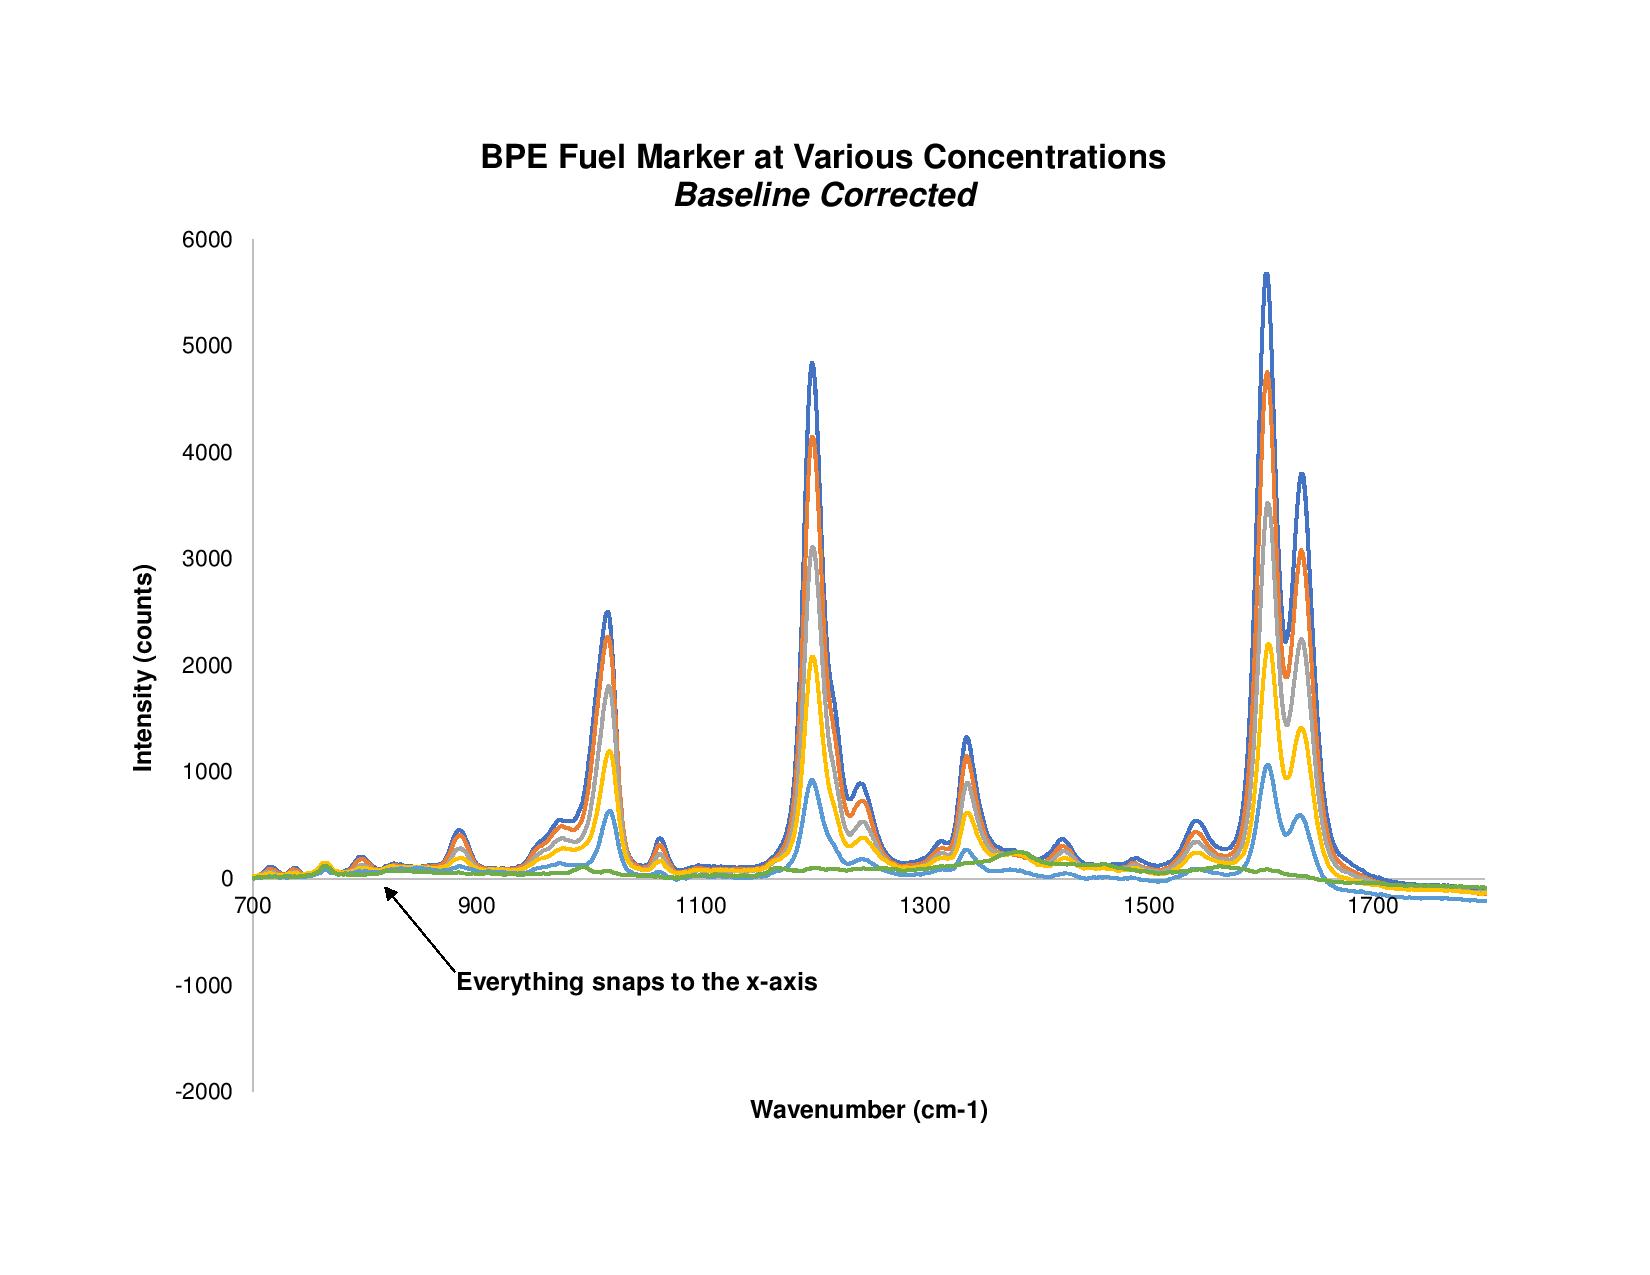
Figure 1. With baselining applied, everything in the raw BPE Raman spectra is snapped to the x-axis.
SNV is a commonly used Raman pre-processing technique that requires you to pick some window within the Raman range to process. Typically, we use 350-3000 cm-1 for Raman, but this will change depending on how the plot looks. Indeed, the range is rather subjective based on the system response, analyte activity and so on.
So, SNV is just the mean value of the full spectrum with the range-average subtracted, and then divided by the range-standard-deviation. It will snap and scale things together like this:
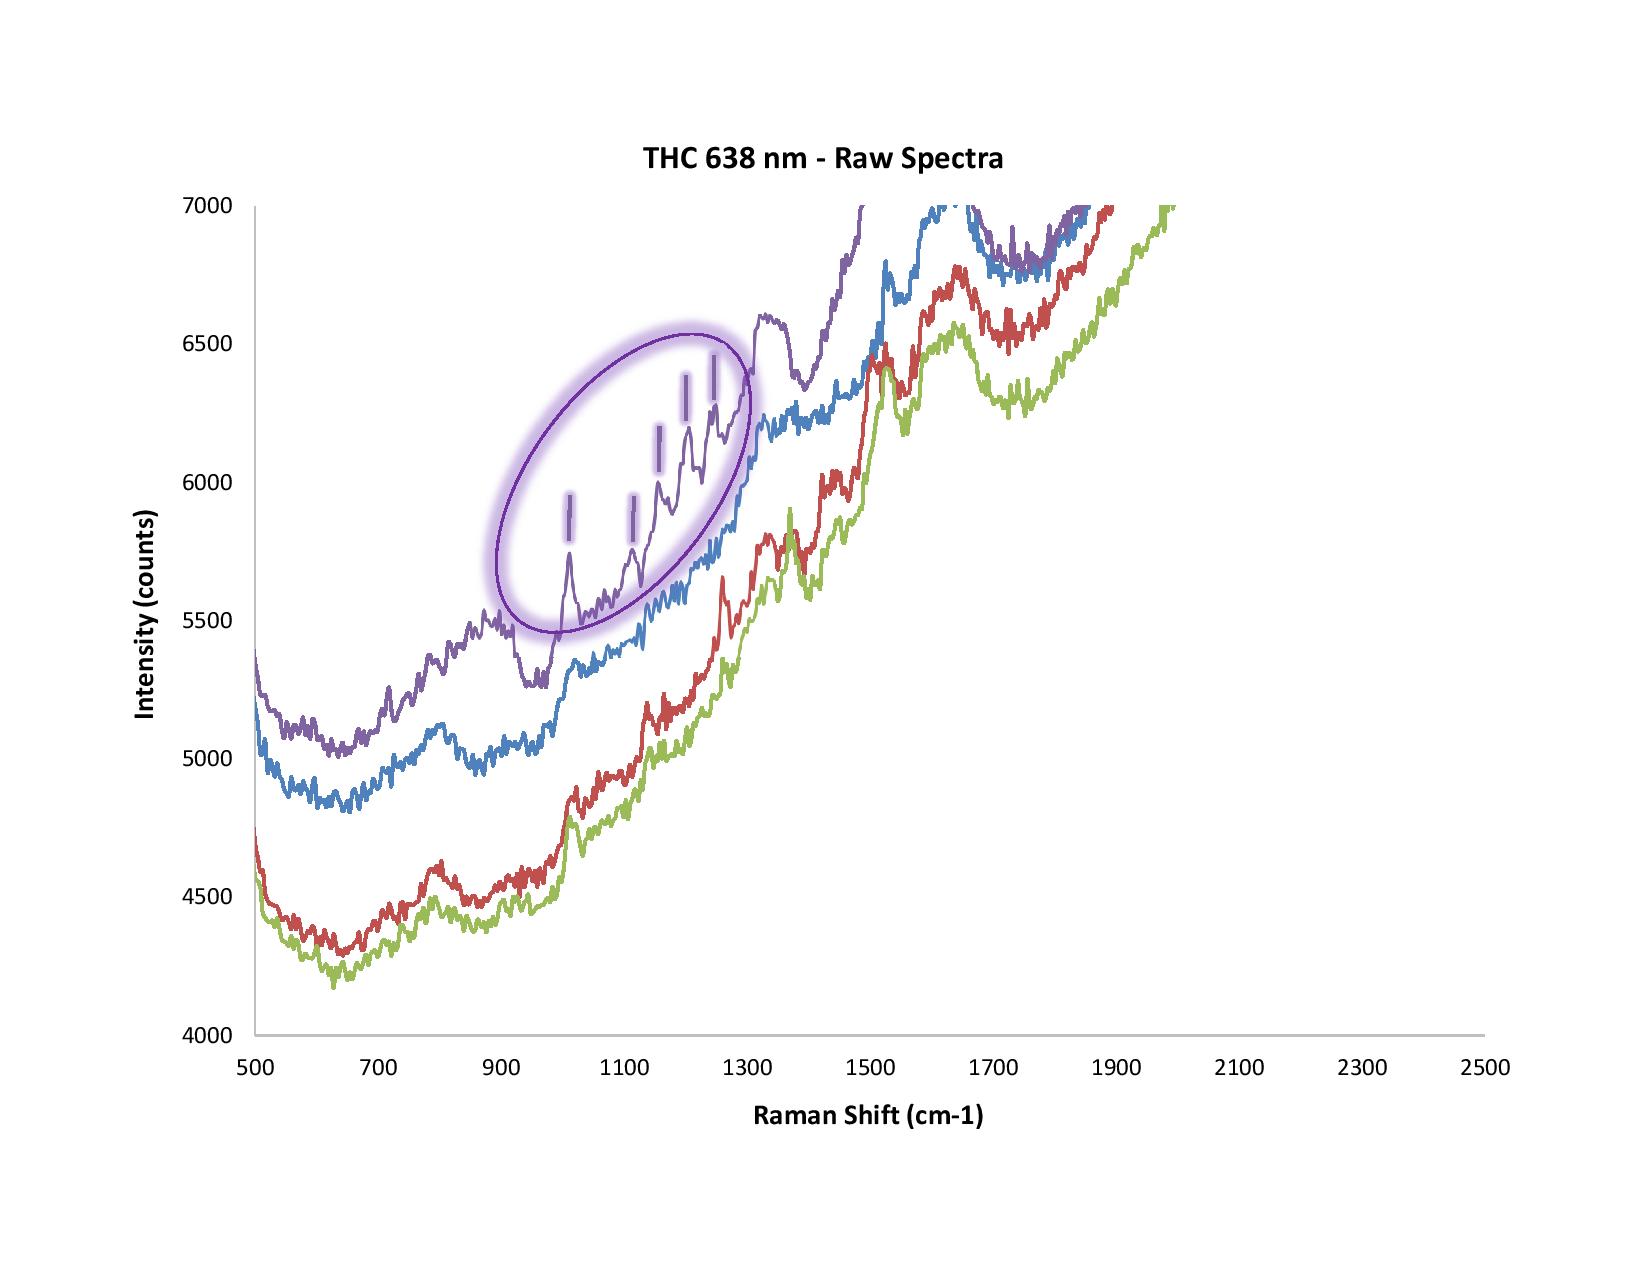
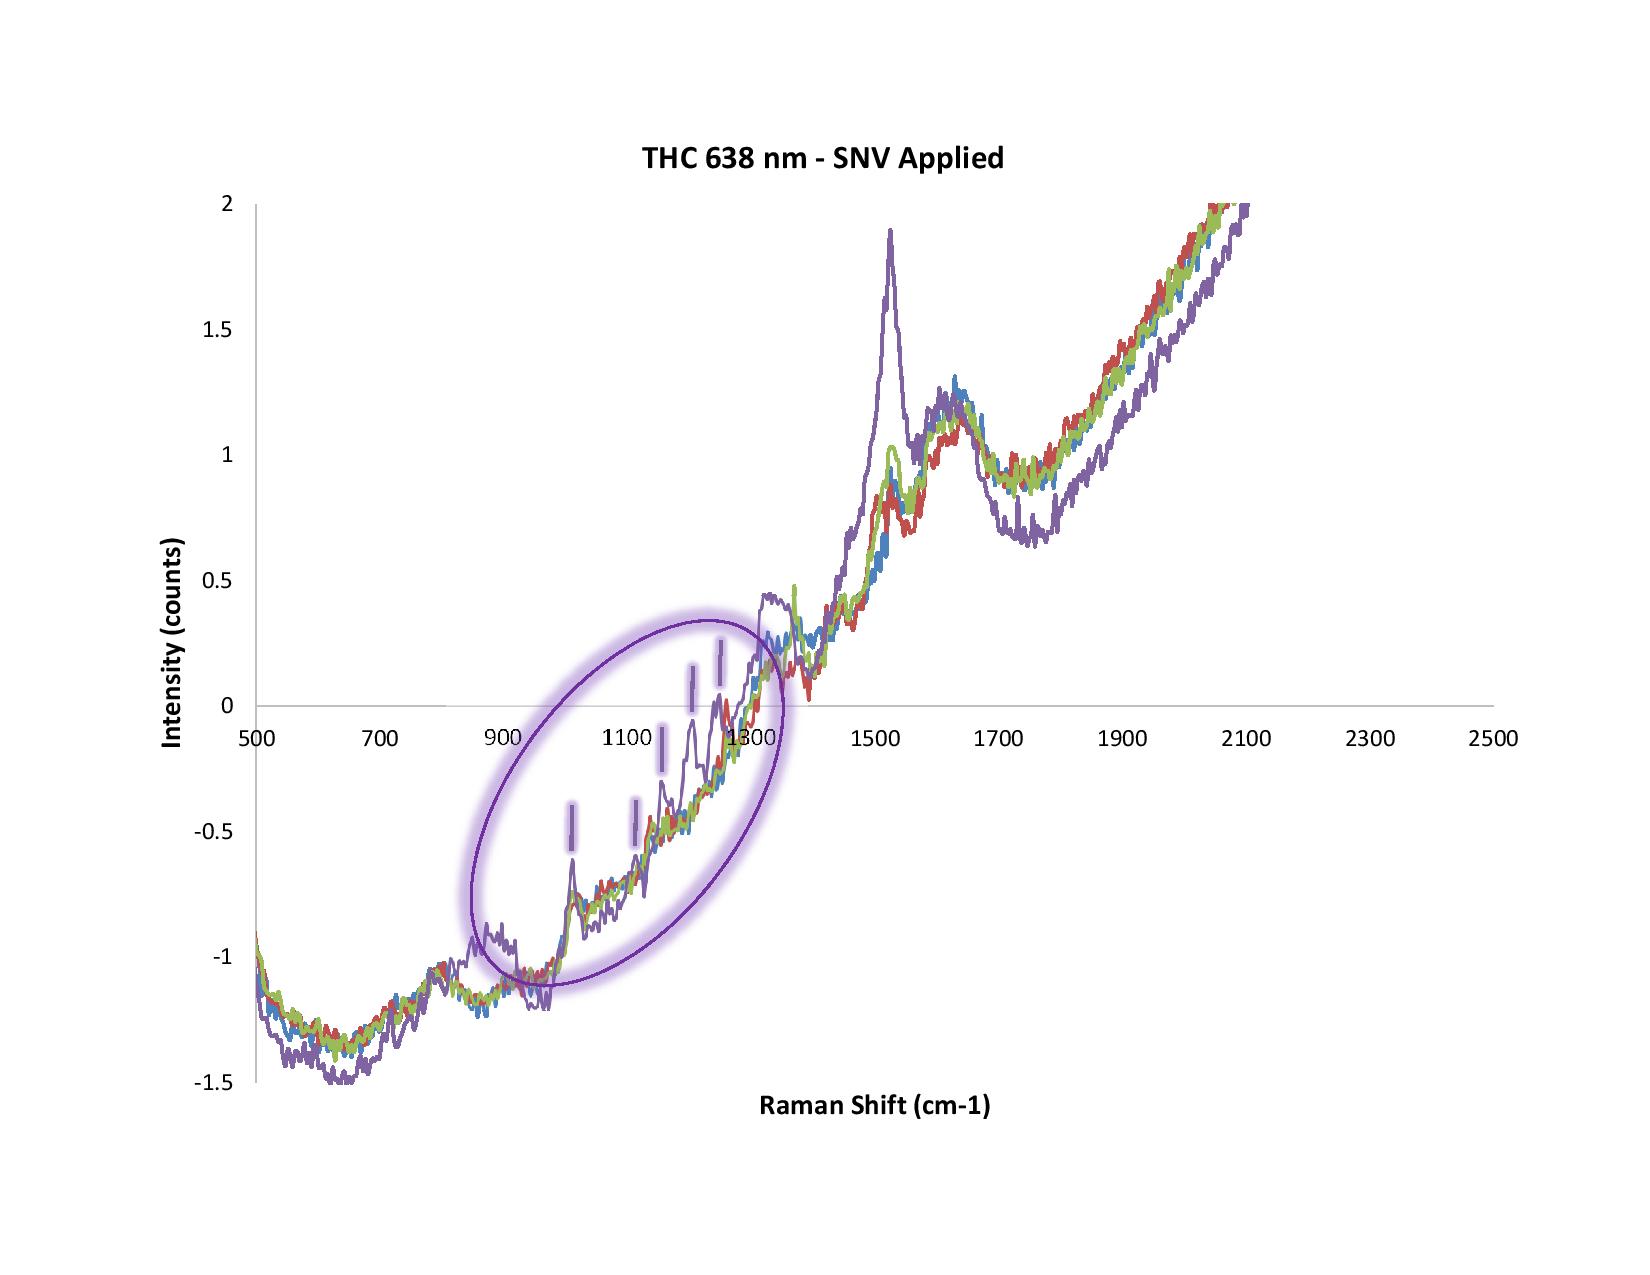
Figure 2. In this example, SERS was used to measure THC. Note the differences between the raw and normalized (SNV) spectra.
In Figure 2, we used Surface Enhanced Raman Spectroscopy (SERS) to measure THC. We’ve circled five peaks around 1100 cm-1, but not the distinct peak at 1500 cm-1 or the other notable spectral features nearby. That’s because in our experience, and after much trial-and-error, we've deduced that the peak at 1500 cm-1 is from the solvent or citrate (used in the SERS substrate); the shape of the other spectral features is somewhat suspect.
When collecting Raman spectra, a useful tool that can be employed in our OceanView operating software is known as “CleanPeaks,” sometimes referred to as "rubberband correction." This is a built-in algorithm that can be applied to raw Raman spectra to remove the baseline and any fluorescence.
CleanPeaks will snap most everything to the x-axis except peaks it deems statistically significant (probably a 3σ threshold). This is very useful to generate clean plots, but it is not the real data from the spectrometer! Take care when using CleanPeaks, as you risk not seeing features in the spectra that are there but were just outside the software’s threshold. So, we recommend using this tool only after you’ve figured out where in your spectra the information you seek is evident.
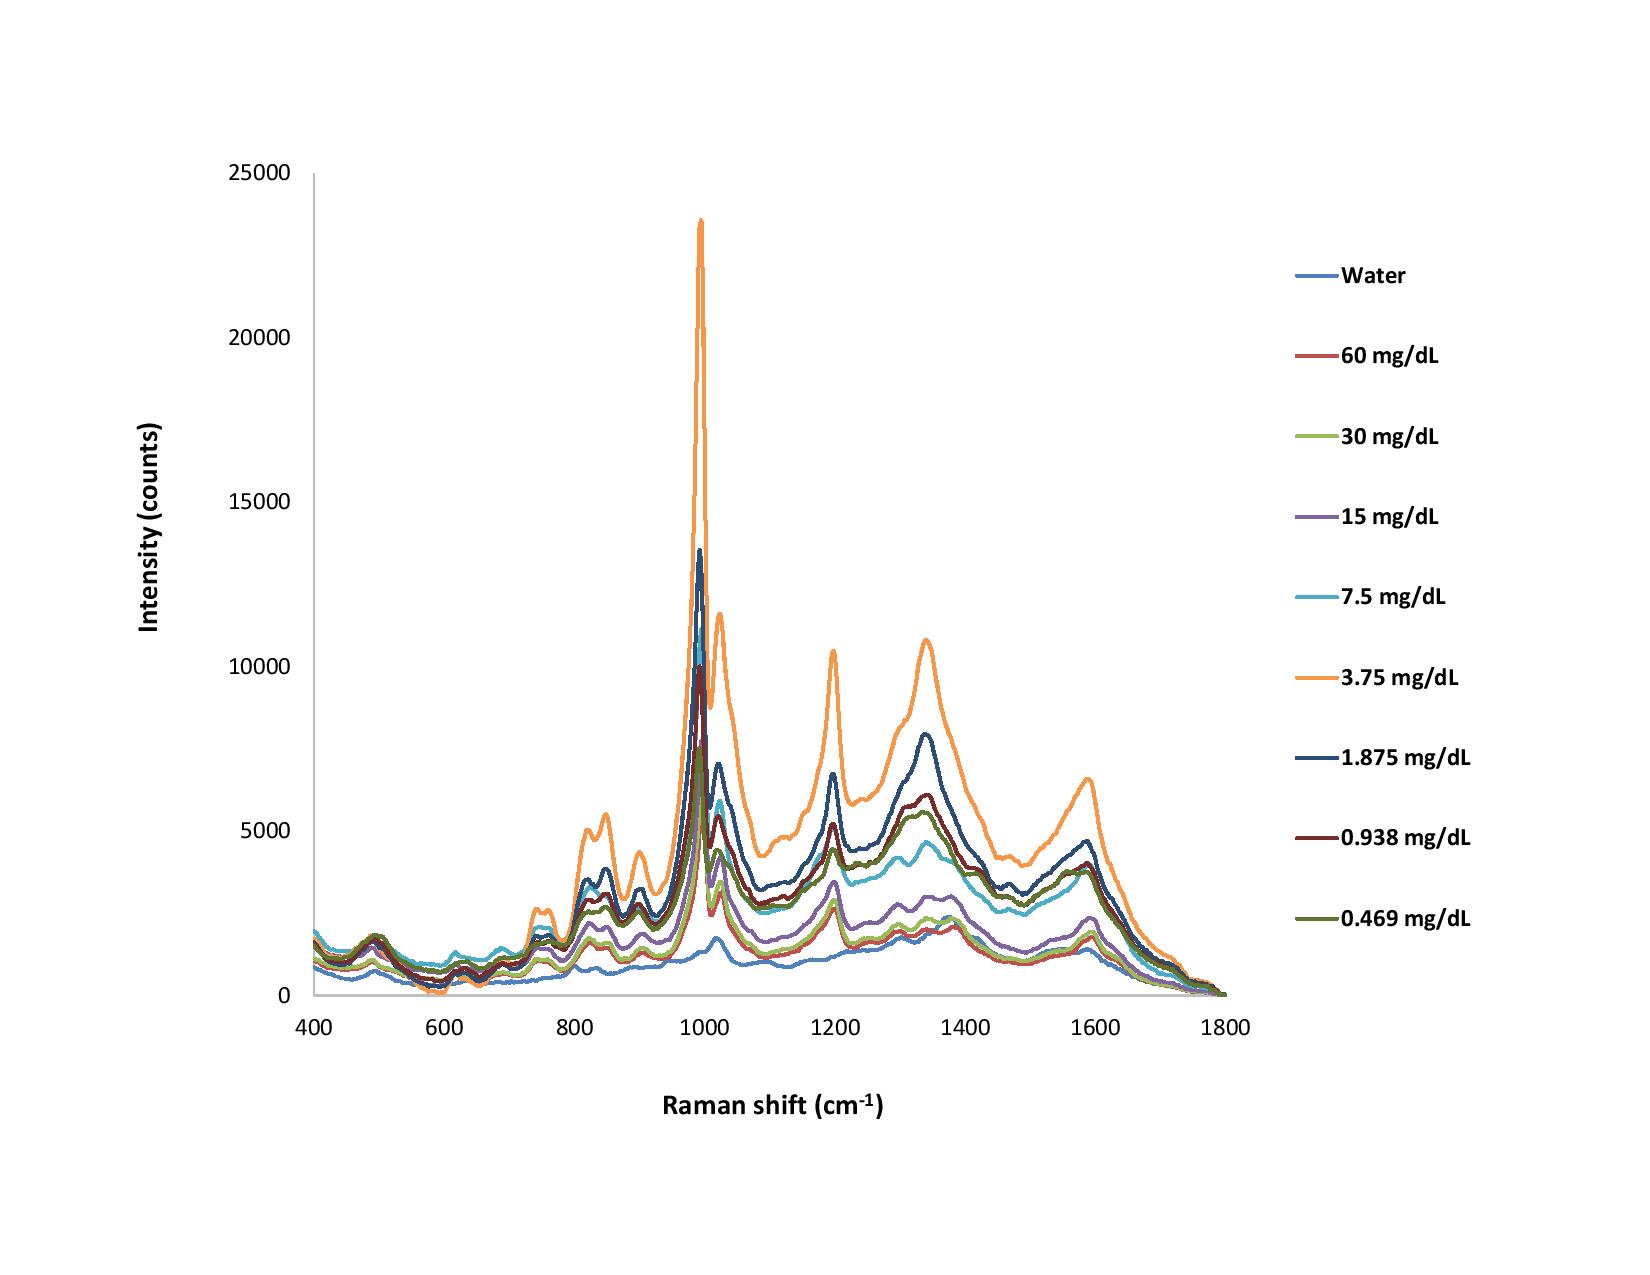
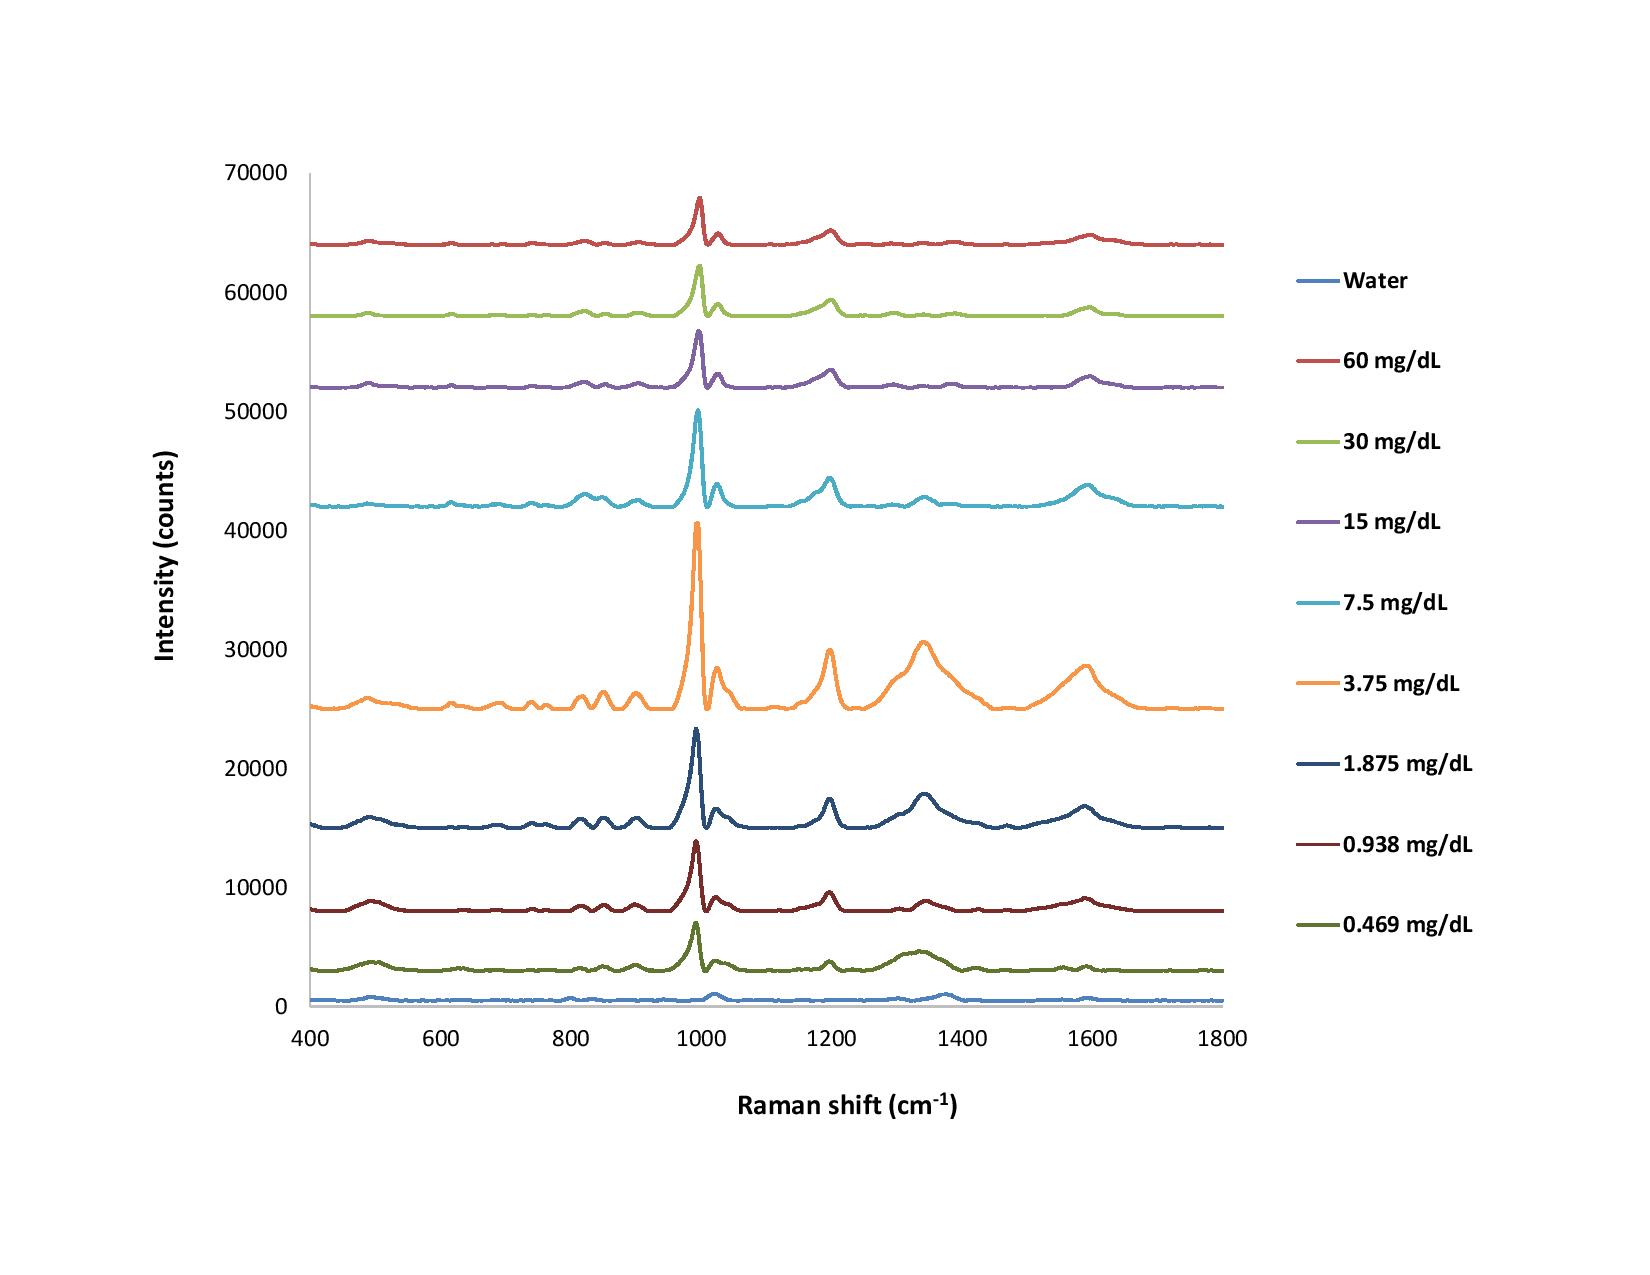
Figure 3. With the CleanPeaks function in software, offsets are applied to the raw Raman spectra for much clearer visualization. The spectra are also flatter overall.
SNV is your best bet, but much of your work will involve some combination of SNV and baselining at different ranges, to see if anything meaningful is happening. We’ll often spend considerable effort trying different approaches and looking for patterns.
For larger data sets of known conditions, Raman outputs can be used as training data for PCA correlations and more intricate statistical analysis. Another option is to use machine learning, but that also usually needs some pre-processing to make the inputs meaningful.
Ocean Insight offers expertise in all of these spectral numerical techniques as well as deployable machine learning. We are eager to learn about your application and provide you the insight you need to turn your spectral data into meaningful answers.

Raman spectroscopy uses scattering of laser light to probe molecular structure. Of every million photons scattered, a single photon will interact with the vibrational states of a sample molecule and emit light of a different wavelength.

Using surface enhanced Raman spectroscopy (SERS) method to detect trace levels of cannabinoids at parts-per-million (ppm) levels.

Learn more tips from Ocean Insight's Dr. Amy Bauer and others on Raman spectroscopy and its applications in the Raman episode of our Applied Spectral Knowledge podcast series.
Options available
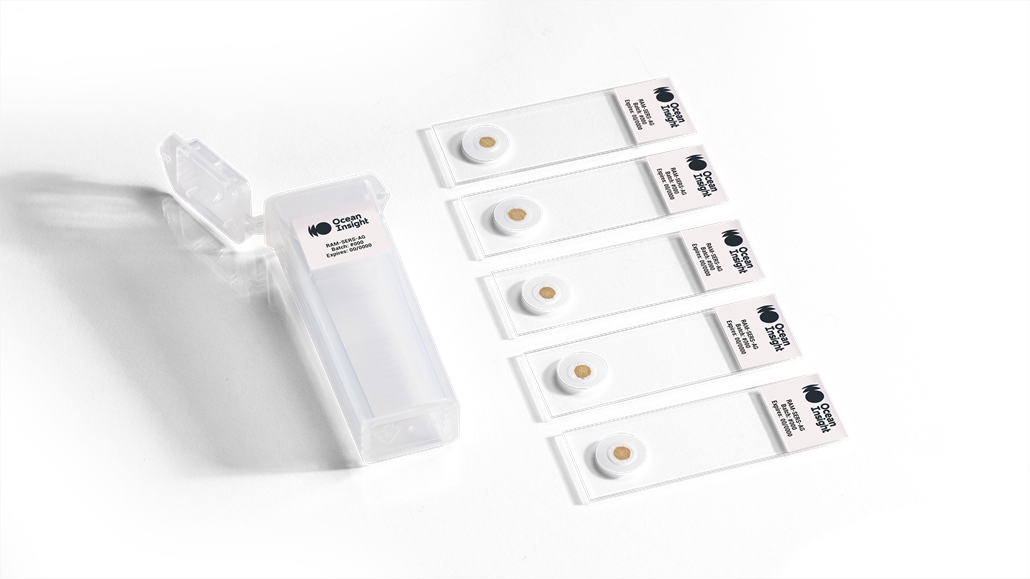
SERS Substrates
Prices From $84.00
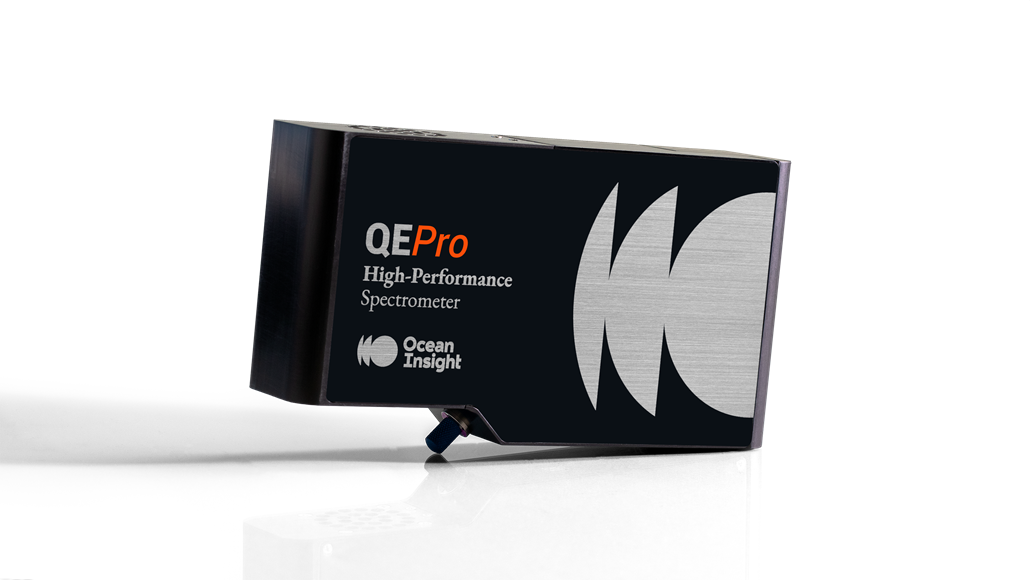
QE Pro Preconfigured Raman Spectrometers

Receive updates from our team as we share application notes, customer spotlights, educational tools, spectroscopy how-to’s, and more.