Subscribe to Our Blog
Receive updates from our team as we share application notes, customer spotlights, educational tools, spectroscopy how-to’s, and more.
Ocean Optics experts discuss key considerations with Raman applications, including the choice of laser excitation wavelength, the importance of maintaining optimal probe focus, and sampling do’s and don’ts.
About Our Experts
Originally captured as part of the Applied Spectral Knowledge Podcast series, this conversation on Raman was led by Yvette Mattley, Ocean Insight’s Lab Services Manager, and features Amy Bauer, Principal Applications Scientist, and our former colleague Anne-Marie Dowgiallo, an authority on Surface Enhanced Raman Spectroscopy (SERS).
Note: These comments have been edited for length and clarity. To hear the complete discussion, tune in to our Meet the Ocean Insight Raman Experts podcast.
Amy Bauer (AB): Raman spectroscopy was named after physicist Sir C.V. Raman, a Nobel Prize winner in 1930 for his invention. Raman was an amazing guy. He was traveling the world in 1921 and absolutely stunned with the blue color of glaciers. So, he started to study light scattering. Despite the simple tools he had at the time, he discovered a type of vibrational spectroscopy that shows molecular bonding. The way Raman is done now is through continuous-wave lasers. The laser hits the surface and most of the light, as we know kind of intuitively, is scattered elastically – i.e., goes out the same color it goes in. However, a very small amount of the light is scattered in the last degree and comes out at slightly different wavelengths or colors. And that depends on the vibrational structure of the chemicals that the laser hits. Each peak in a Raman spectrum corresponds to a given molecular vibration so that we're looking at individual bonds.
AB: Raman spectroscopy is used in many cases to provide an identification of an unknown compound. Any pure material has a unique Raman spectrum, and can be used to provide this gorgeous identification in cases where there's not fluorescence in the way and there is adequate signal level. But it is very specific spectroscopy.
Yvette Mattley (YM): I’ve found Raman to be amazing. My favorite example is to look at the spectrum for ortho-para-xylene and meta-xylene, which have the same chemical formula, identical with respect to chemical formula. But you're just moving one atom around this ring and as a result, the Raman spectra are so different from one another. So, I absolutely love Raman for fingerprinting.
AB: Another good example is the use of Raman spectroscopy to identify plastics for recycling. And the reasoning there is very similar. Polymer chains -- they're all carbon-hydrogen, carbon-carbon bonds, for the most part. And the place where the unsaturation occurs, it drives the Raman spectrum to the point where you can tell the difference between, for example, two types of nylon.
Anne-Marie Dowgiallo (AMD): SERS is a variant of Raman that allows you to increase the Raman signals from molecules that may be attached to a metallic surface or a metallic nanoparticle. And usually these are gold or silver nanostructures that are anywhere from 10 nm to 100 nm in size. Or you can use a roughened metallic surface and whenever the molecule is in very close contact, you will observe a much stronger Raman signal. So, if you're looking at low concentrations of a certain analyte, you'd probably want to use SERS rather than Raman because Raman is only going to work on bulk samples.
YM: My understanding is that only about one out of a million photons that you put into a sample is going to get Raman scattered. So, I'm always amazed that standard Raman works at all with those kinds of odds. But now when you put these the nanoparticles in there, we start to see that we can get a significant signal enhancement, right?
AMD: Yes. With SERS, you can see anything from 104 types of enhancement levels. Up to 1014 have been reported.
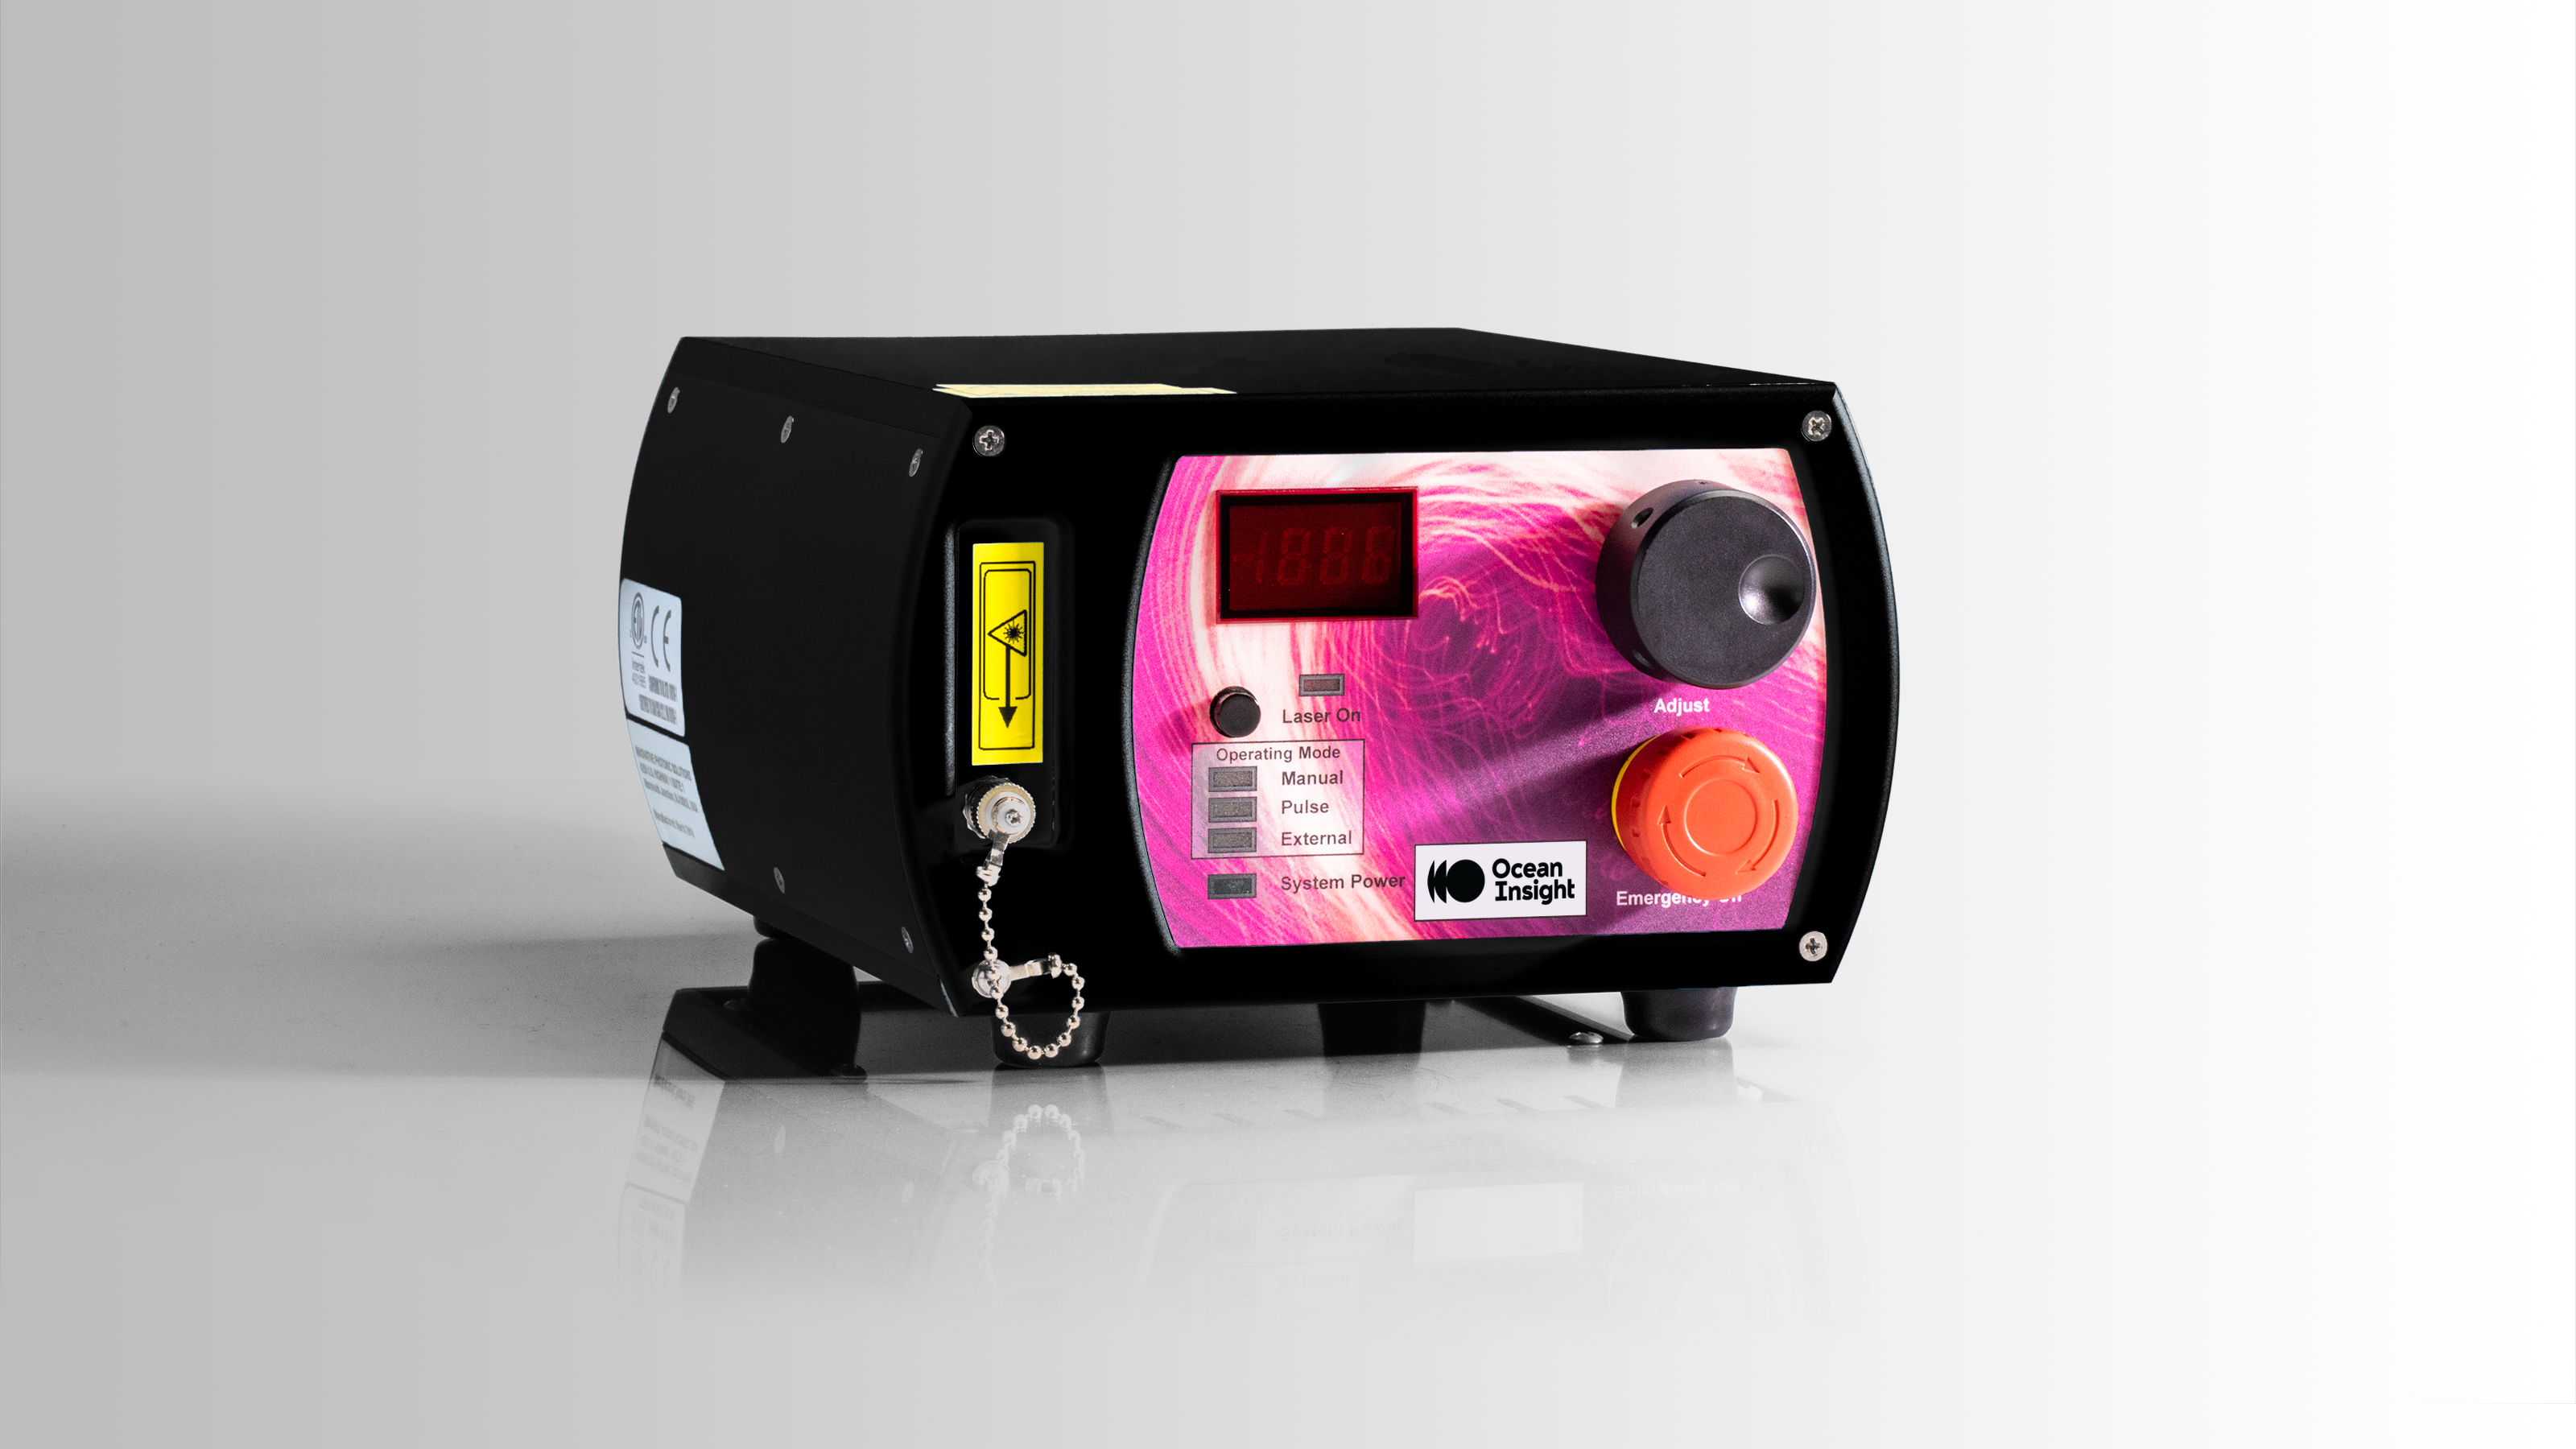
YM: Let's address some of the questions that customers may have when they start using Raman in their laboratories. One is that many different wavelengths are available for excitation – 532 nm, 785 nm, 1064 nm. And sometimes the customers are not sure which wavelength to use.
AB: It's kind of hard to tell which is going to work the best, and I'll tell you why. Raman signals scale strongly with the wavelength of the excitation light and get stronger with shorter excitation wavelengths. So, there are people in the research communities who are even using tripled Nd: YAG lasers to perform these analyses. So, way out there in the 266 nm region. And so, you're asking yourself, OK, why don't we don't sell one of those, and why are they not popular in literature?
Well, at the very same time the Raman signal is scaling positively with decreased wavelength, the principal problem that we encounter when we perform Raman spectroscopy is also scaling that way. And of course, I am discussing our evil nemesis, fluorescence. As the wavelength of the exciting light decreases, the Raman signal increases, but so does fluorescence. And fluorescence can really overtake signals with the shorter wavelength lasers. That's what is driving the development of longer wavelength Raman systems with bright, stable semiconductor lasers. So, the people measuring biological samples, for example, are using 785 nm and 1064 nm because they are worried about seeing fluorescence.
AMD: As Amy mentioned, the fluorescence is a concern when you're at 532 nm. But I've seen people use 532 nm with semiconductors, different polymers, minerals, things like that. And with regards to SERS, if you're going to use silver nanoparticles then 532 nm is going to be your laser wavelength of choice because you have the best resonance conditions there. For the gold nanoparticles, we use 785 nm.
YM: So, if we're going with SERS, then the excitation wavelength is going to be dictated by the nanoparticles that we're using. If we're doing standard Raman, then 785 nm is sort of a sweet spot that a lot of people have used because of the trade-off between the excitation wavelength and the intensity of the Raman spectra, and with the intensity of the fluorescence. Ultimately, though, you just have to be willing to try different wavelengths and see what’s going to give you what you need.
AB: For sure. But another thing about that is, fluorescence is really a strange and perhaps non-linear function of excitation power. So, there can be situations where maybe you don't have the optimal wavelength, maybe you're just kind of stuck with what you have. But if you play around with the input power, you can often optimize the Raman signal in the presence of fluorescence such that you can use software to remove that background.
YM: Optimizing your Raman setup is not just a matter of throwing a vial into the setup and getting spectral data. What do users need to account for when getting ready to measure their samples?
AMD: The focus is very important when you're doing a Raman measurement. The probes that we use have a focal distance of about 7.5 mm from the end of the probe. This is where the laser spot is going to be tightly focused and have the highest power density when it's hitting your sample. And that's critical because higher laser powers will lead to more intense Raman signals.
But you must be careful because you can damage samples during Raman, especially if you work in the lower wavelengths. You must figure out the best parameters for your sample without damaging it. Is it solid? Is it liquid? And with a SERS substrate, you can't really go above laser power of about 15 mW when you're focusing the laser. Also, you don't want to go above 100 mW on other types of substrates because you can damage the molecule or the analyte. But with Raman going through a vial, things that our customers have encountered when it comes to focusing the laser, is that they will focus the laser on the walls of the vial or the cuvette, and they'll see a really strong peak form, around 1300 cm-1 or 1400 cm-1. And so, what you want to do is adjust the position of the probe with respect to the vial to make sure that you're focusing on your sample and minimizing that peak.
AB: There is a terrible region between incinerating your sample and getting an appropriate Raman signal. And it's kind of hard to identify this “just before burning” set of conditions. I want people to be on the lookout for a Raman spectrum that looks interesting but doesn’t stick around, and that you can't reproduce because it's the Raman spectrum of the actual burning process. I haven't seen this a lot of times, but we were joking previously that you're not a Raman spectroscopist unless you’ve lit something on fire. There is this point where you seem to have a decent Raman spectrum with information in it and then you can't reproduce it at the same focal point on the same sample. And what that means is you just failed to notice that you burned your sample away.
YM: Raman is a wonderful technique, but not the answer to everything. And there are, of course, ways to make modifications to the procedure, to improve the specificity and the detectability limits with Raman. But Raman is not the answer to everything.
AB: Yes. For example, laser power on absorptive materials is a non-starter. While Raman in general is great for identifying plastics, it's terrible at identifying plastics that have been loaded with carbon black. And you guys know from personal experience that your car is loaded with black plastic. Raman is miserable at identifying that. The best sort of result you can hope for is the double-hump carbon black feature and strong attempts not to burn the plastic.
AMD: With most pure metals, you're not going to get a Raman spectrum. And some other samples that I've had difficulties with are very thin films. They're difficult to measure if you don't have a microscope setup where you can finely adjust the focus. You can measure Raman in thin films, of course. But in my experience, they've been a little more difficult. And then anything that is low concentration is going to be challenging, especially if you have a low concentration analyte complex matrix, like biological fluids such as blood or saliva. So those types of samples are going to be very challenging with Raman.
YM: Does SERS work with those low-concentration samples?
AMD: Low concentration samples are easy with SERS, but in complex matrices they are more challenging. But there are ways to make it work.
AB: It's important to distinguish between the two types of Raman being unfriendly that Annie mentioned. In the case of pure metals, there are no classic molecular bonds there to be seen. Pure metal is not good with Raman noble gases, not good with Raman. But in the case of complicated mixtures, using computer software and chemometrics can help, or in the case of thin films, careful sample preparation and presentation would improve with a microscope.
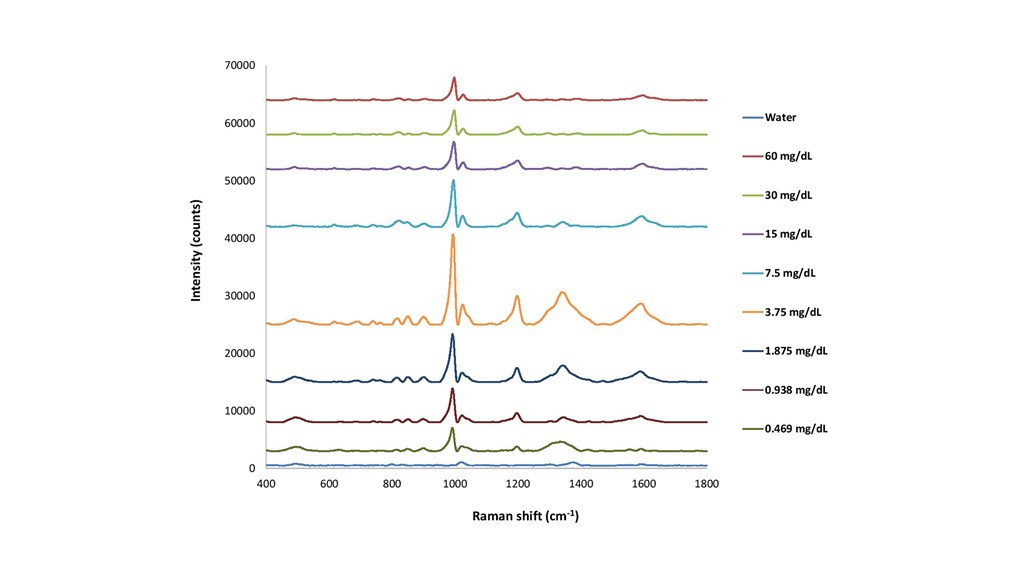
YM: How does quantification work with, let’s say, challenging applications such as blood measurements? Have we been able to quantify anything in biological mixtures?
AMD: Yes, in human blood. We used the intensity of one of the main Raman peaks for the analyte of interest that we were studying. We then used that to correspond it to the amount of the material present, so that we were able to get a good concentration curve from those measurements.
AB: Quantification is very possible. The physics of the thing make the feature height or feature area scale linearly with concentration. So, that all works fine. But especially if you're looking at a simple measurement and a simple matrix like, say, soft food and water. That's the thing that I've done quantitatively well. I think things get messier with more complicated matrices, just because they're there's no such thing as a clear, unique feature to provide as a basis for that quantification.
AMD: One tip that I give people is to use the feature in OceanView software known as CleanPeaks. It’s a built-in algorithm in OceanView that can be applied to the raw Raman spectra, and it removes any baseline or fluorescence. It helps snap the spectra down to a flat baseline, which is nice for presenting the data and showing the peaks in a much cleaner graph, without all that background noise.
Editor's note: Learn more about CleanPeaks and other Raman measurement tips.
YM: I've been making Raman measurements for a few years, but it's always great to hear from experts who are working with Raman setups and samples day in and day out. What really comes through is the specificity and sensitivity of Raman, especially when you're using the SERS substrates. And that you need to spend the amount of time necessary to optimize your procedures and make sure you’re getting the best data.

Learn more tips from Ocean Insight's Dr. Amy Bauer and others on Raman spectroscopy and its applications in the Raman episode of our Applied Spectral Knowledge podcast series.
We offer suggestions for making sense of the sharp peaks and jagged shapes you’ll find in Raman spectra. Raman signatures can be used as is or matched to a known database for materials identification.
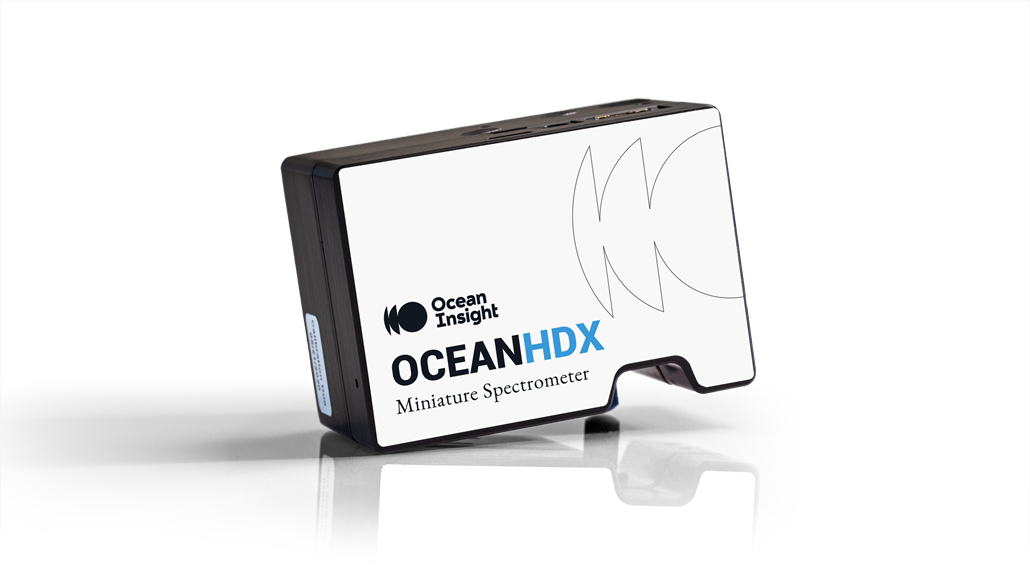
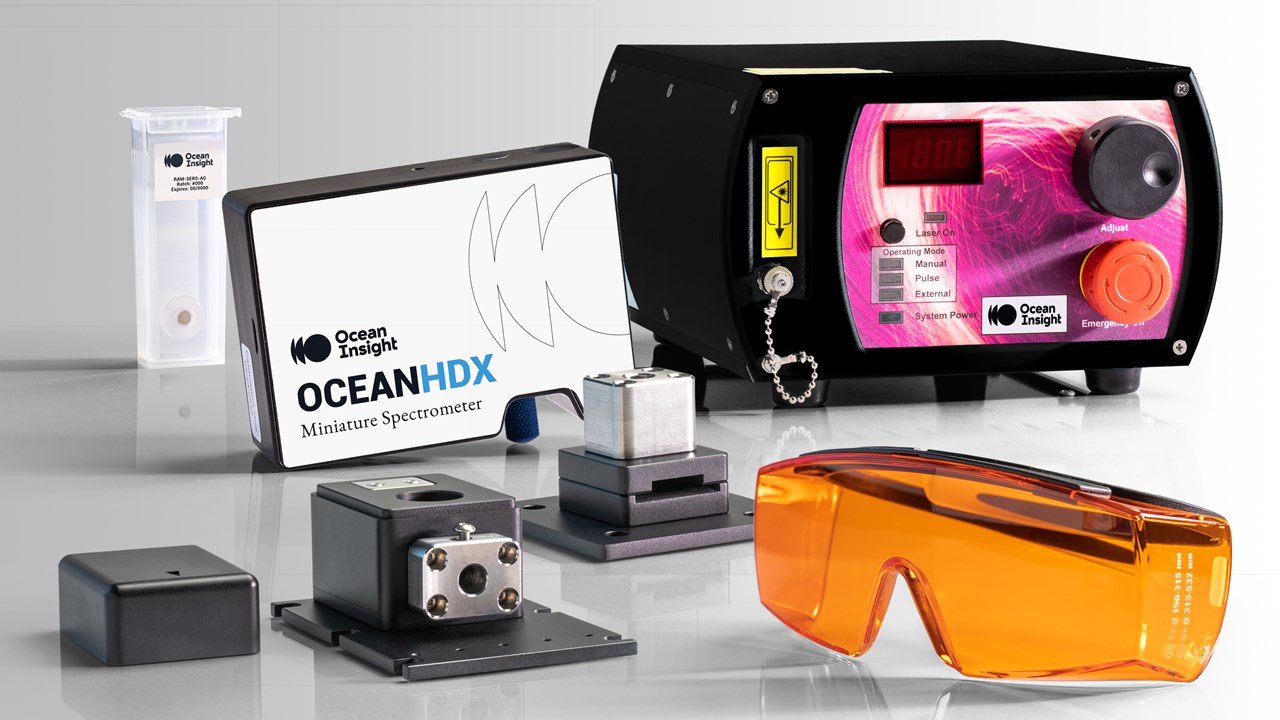
Ocean HDX 785 Preconfigured Raman Spectrometers
Options available
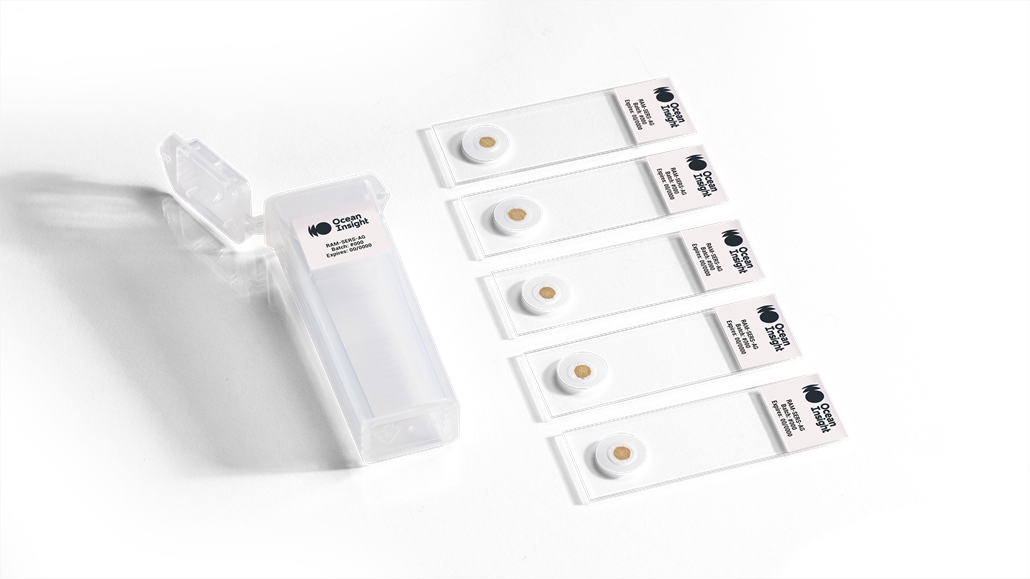
SERS Substrates
Prices From $84.00

Receive updates from our team as we share application notes, customer spotlights, educational tools, spectroscopy how-to’s, and more.