Subscribe to Our Blog
Receive updates from our team as we share application notes, customer spotlights, educational tools, spectroscopy how-to’s, and more.
In this application note featuring the QE Pro-Raman+ spectrometer, we examine the curing rate of a two-part epoxy as a model system for monitoring the kinetics and reaction completion of industrial processes.
IMPORTANT: PLEASE REFRESH YOUR BROWSER IF YOU DO NOT SEE ANY IMAGES/SCREENSHOTS ON THE PAGE.
Note: The author of this application note is Amy J. Ray Bauer, Ph.D., Principal Applications Scientist.
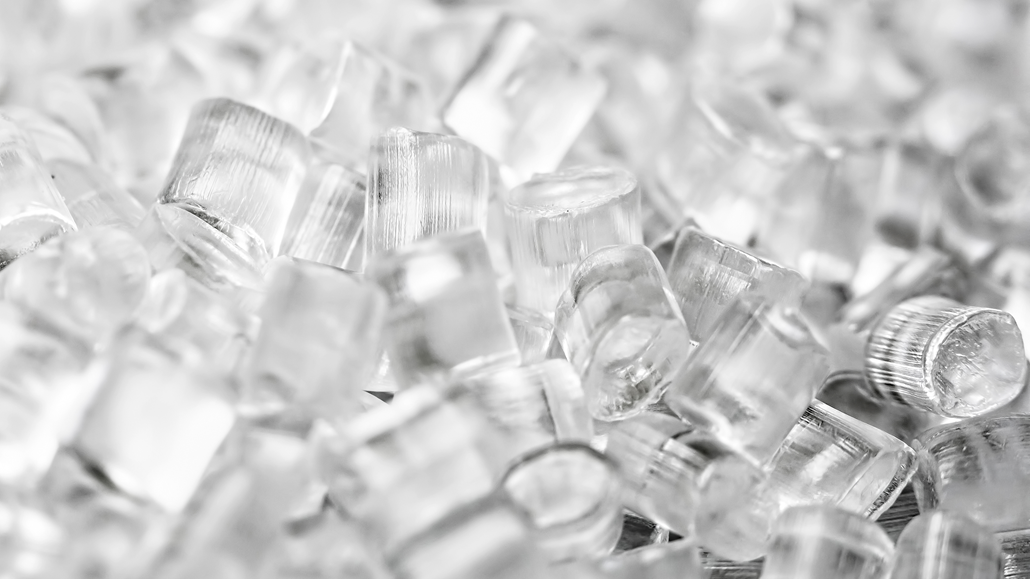
Epoxy is a general term referring to epoxy resins, both the individual components and the cured results. Epoxy resins are a family of reactive polymer precursors and polymers that include epoxide groups. These resins are used in an extensive array of consumer and engineering applications because of their durability, strong adhesion, chemical resistance, and other specialized properties.
Epoxy resins are used in the manufacture of adhesives, plastics, paints, coatings, primers and sealers, flooring and other products and materials that are used in building and construction applications. Most materials known as “structural” or “engineering” adhesives are epoxies. These high-performance adhesives are used to make laminated woods for decks, walls, roofing and other building applications, as well as in other products that require strong bonds to a variety of substrates including concrete and wood. Epoxies can stick to metal, glass, stone, wood and some plastics, and are more heat- and chemical-resistant than most glues.
However, all these properties are contingent on proper proportions and mixing. In this application note, we use a readily available two-part epoxy as a model system for monitoring the kinetics and reaction completion of industrial processes, generally, and adhesive curing, specifically.
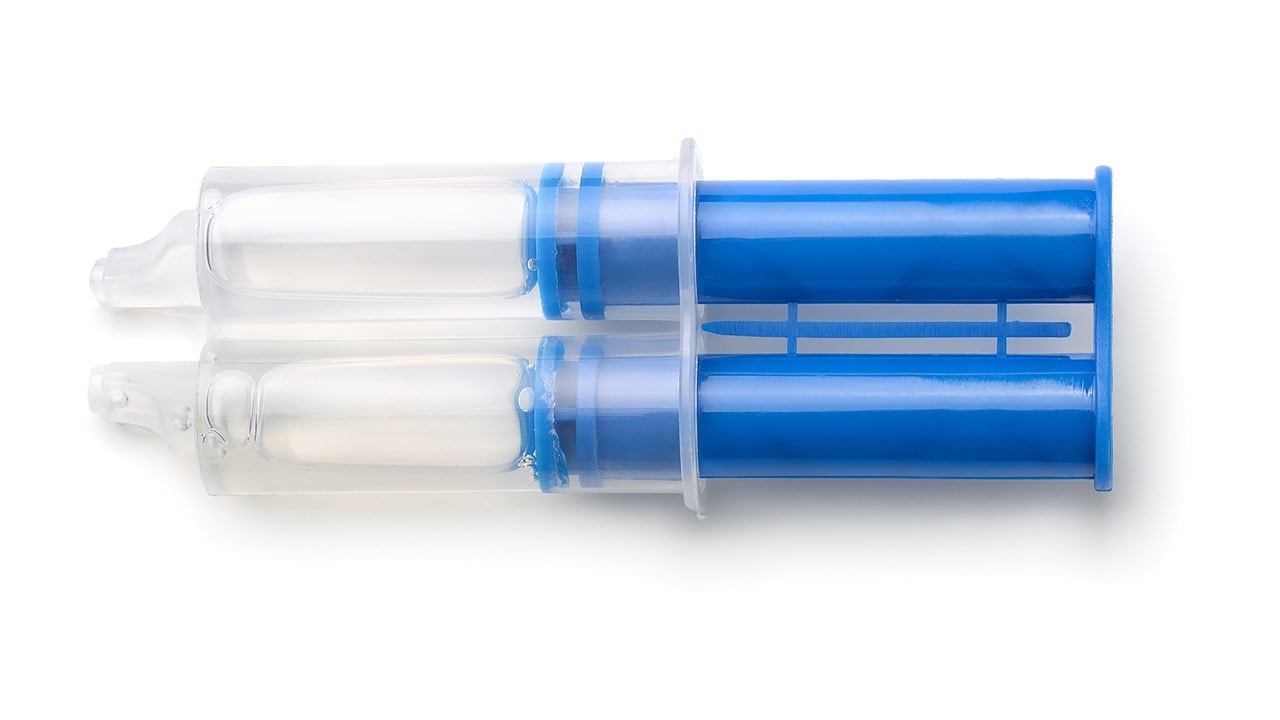
The two-part epoxy used in this demonstration, Devcon® 15 Minute Epoxy, is composed of bisphenol A diglycidyl ether resin and a polymercaptan/polyamine mixture (2,4,6-tri-(dimethylaminomethyl)-phenol and mercaptan amine blend). Mercaptan is an organo-sulfur compound that donates a thiol group to the curing process. Thiols react readily with the epoxide group and are typically used where heat cures are not possible, or a fast cure is needed.
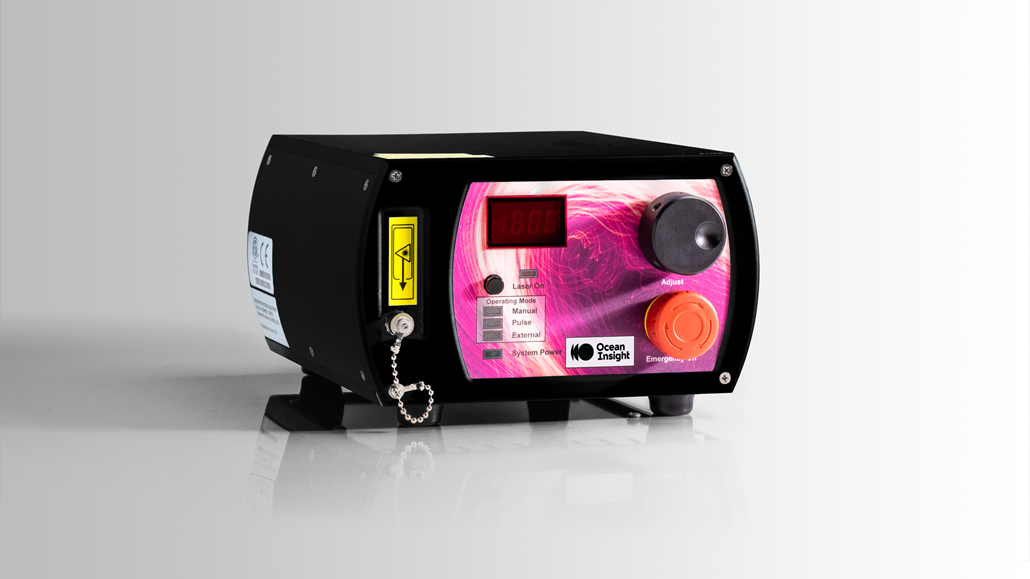
To monitor the curing process, we used an Ocean Insight QE Pro-Raman+ with a 300 mW, 785 nm laser (LASER-785-LAB-ADJ-FC) and a Raman probe (RIP-RPB-785-FC-SMA) suspended at a fixed distance over the curing epoxy. Ambient light was excluded from the laser-sample interaction region with a black cloth. Raman signals were acquired with 3 s acquisition time and 10x averaging. Signals were acquired on the epoxy samples immediately upon mixing and then in 2-3 minute intervals after that. In some cases, signals were acquired the following day, but in no instance did these signals vary appreciably from those collected at 40-45 minutes after mixing.
Two samples of different proportions of resin and hardener were mixed, at the recommended ratio of 1:1 and at a 2:1 hardener-to-resin mixture. Following the mixing of the two components, the curing process was monitored with Raman spectroscopy. The analytical focus was principally on the epoxide and thiol features, which diminish upon curing.
Raman bands corresponding to epoxide vibrational frequencies have been reported previously [1], with 1254 cm-1 assigned to be the breathing mode of the epoxide ring (Figure 1). The intensity of this peak is linearly dependent on the concentration of epoxide groups in the resin mixture [1 and references therein]. The peak at 921 cm-1 is likely the epoxide ring deformation and is much weaker. The Raman peaks at 1114 cm-1, 1186 cm-1 and 1610 cm-1 have been assigned to resin backbone vibrations and do not change in intensity during the curing reaction.
The change of the 1254 cm-1 feature with time can be interpreted as the consumption of the free epoxide groups during the vitrification of the epoxy. The reduction of the intensity of the Raman feature at 2575 cm-1 shows the consumption of the thiol in the hardener as the material reacts. The rate of the initial loss of the S-H feature appears to be a function of the initial concentration of the hardener.
The S-H stretch, related to the presence of thiol, is readily observed at 2575 cm-1. In the case of the measurement of 1:1 hardener-to-resin, the S-H feature is still present when the curing process stops. Note that this sample was still slightly sticky to the touch the next day, far after the 15 minute cure time assured on the package. This result could be due to either the incorrect proportions of the two substances or perhaps inadequate mixing of the two.
In the 2:1 hardener-to-resin sample, the initial peak of the thiol feature is slightly higher than in the 1:1 case (Figure 2). This was not evaluated for quantitative behavior, but the ratios of peak heights seem reasonable given that in the 2:1 case, the hardener accounts for 67% of the total material present (two-thirds) and in the 1:1 case, only 50% (one-half). In this second case, there is not enough resin to react stoichiometrically with the available resin, and there is an appreciable amount of thiol remaining in the product epoxy. It is not surprising that the epoxy did not cure well in this case, either.
The S-H feature (analyzed using peak area from 2487-2639 cm-1) in the case of the 2:1 mix comprises about 1.36x more integrated area than that associated with the 1:1 mix. This agrees with the fact that in the 1:1 mix, there is 50% hardener. In the 2:1, there is 67% hardener (a 1.34x increase).
The 2:1 mixture has an appreciable amount of S-H remaining; 1:1 has less S-H remaining at the end of the cure.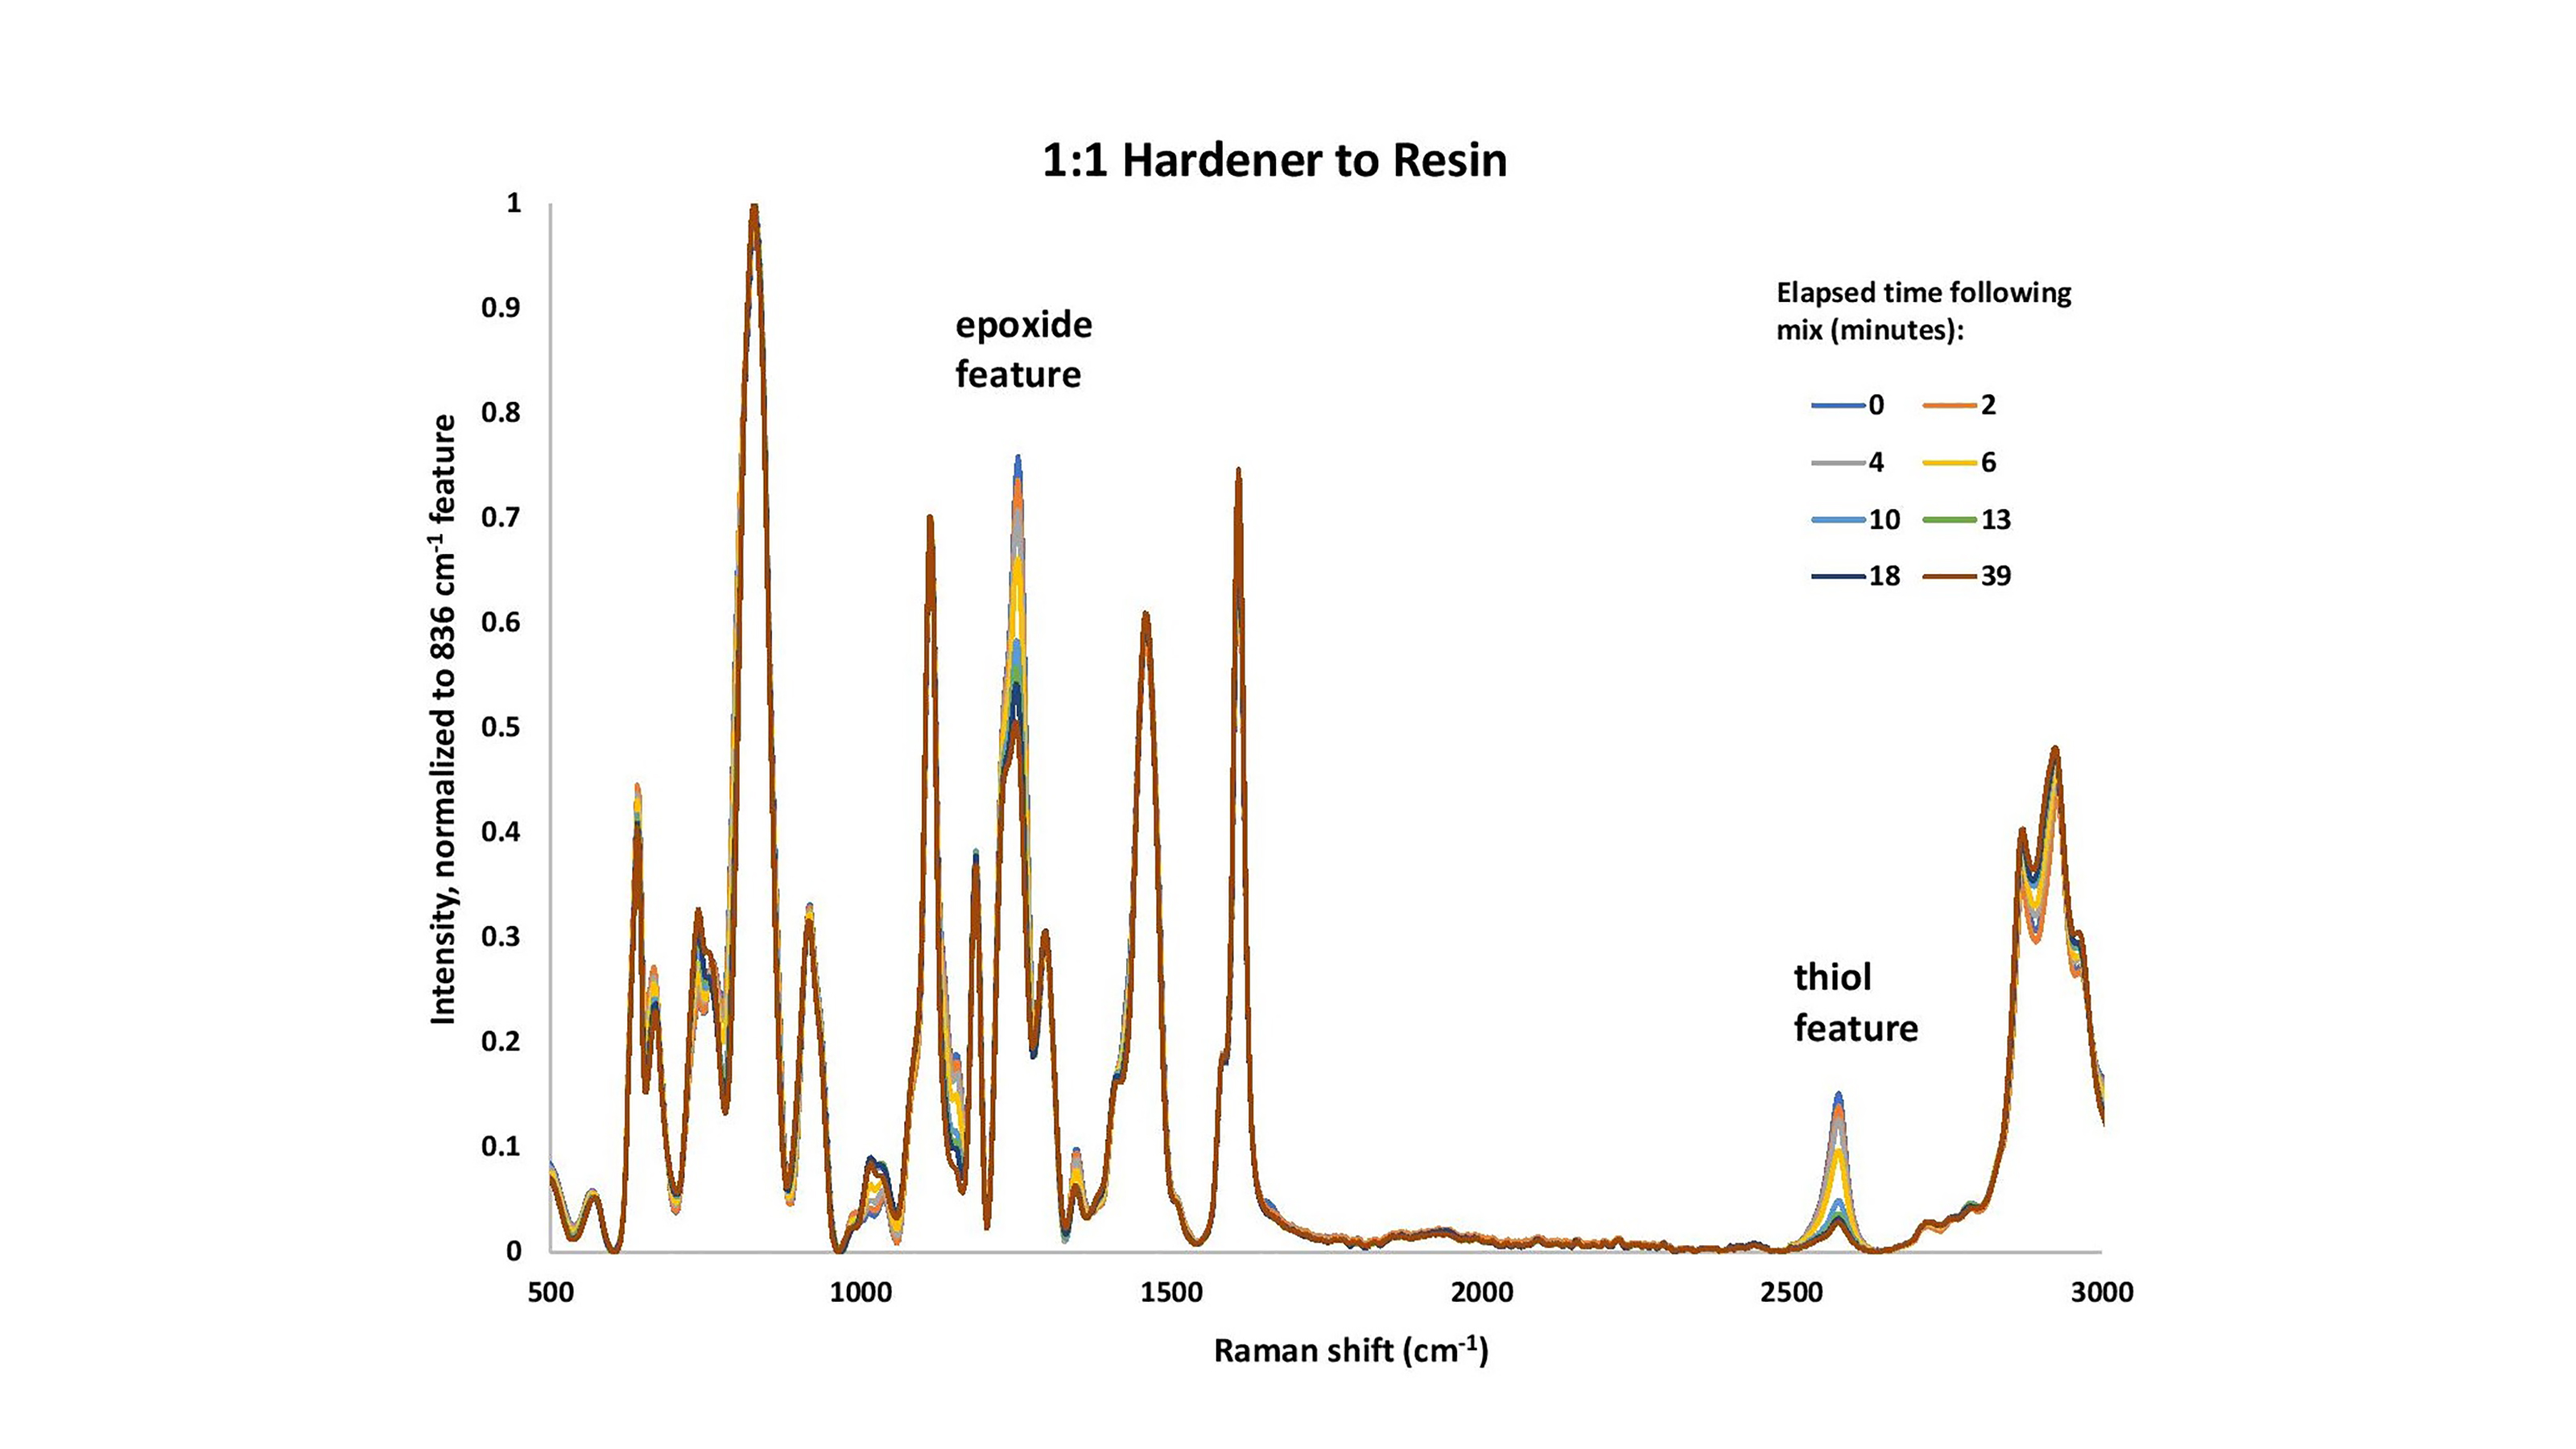
Figure 1. Devcon® 15 Minute Epoxy (1:1 resin to hardener), as a function of cure times (minutes).
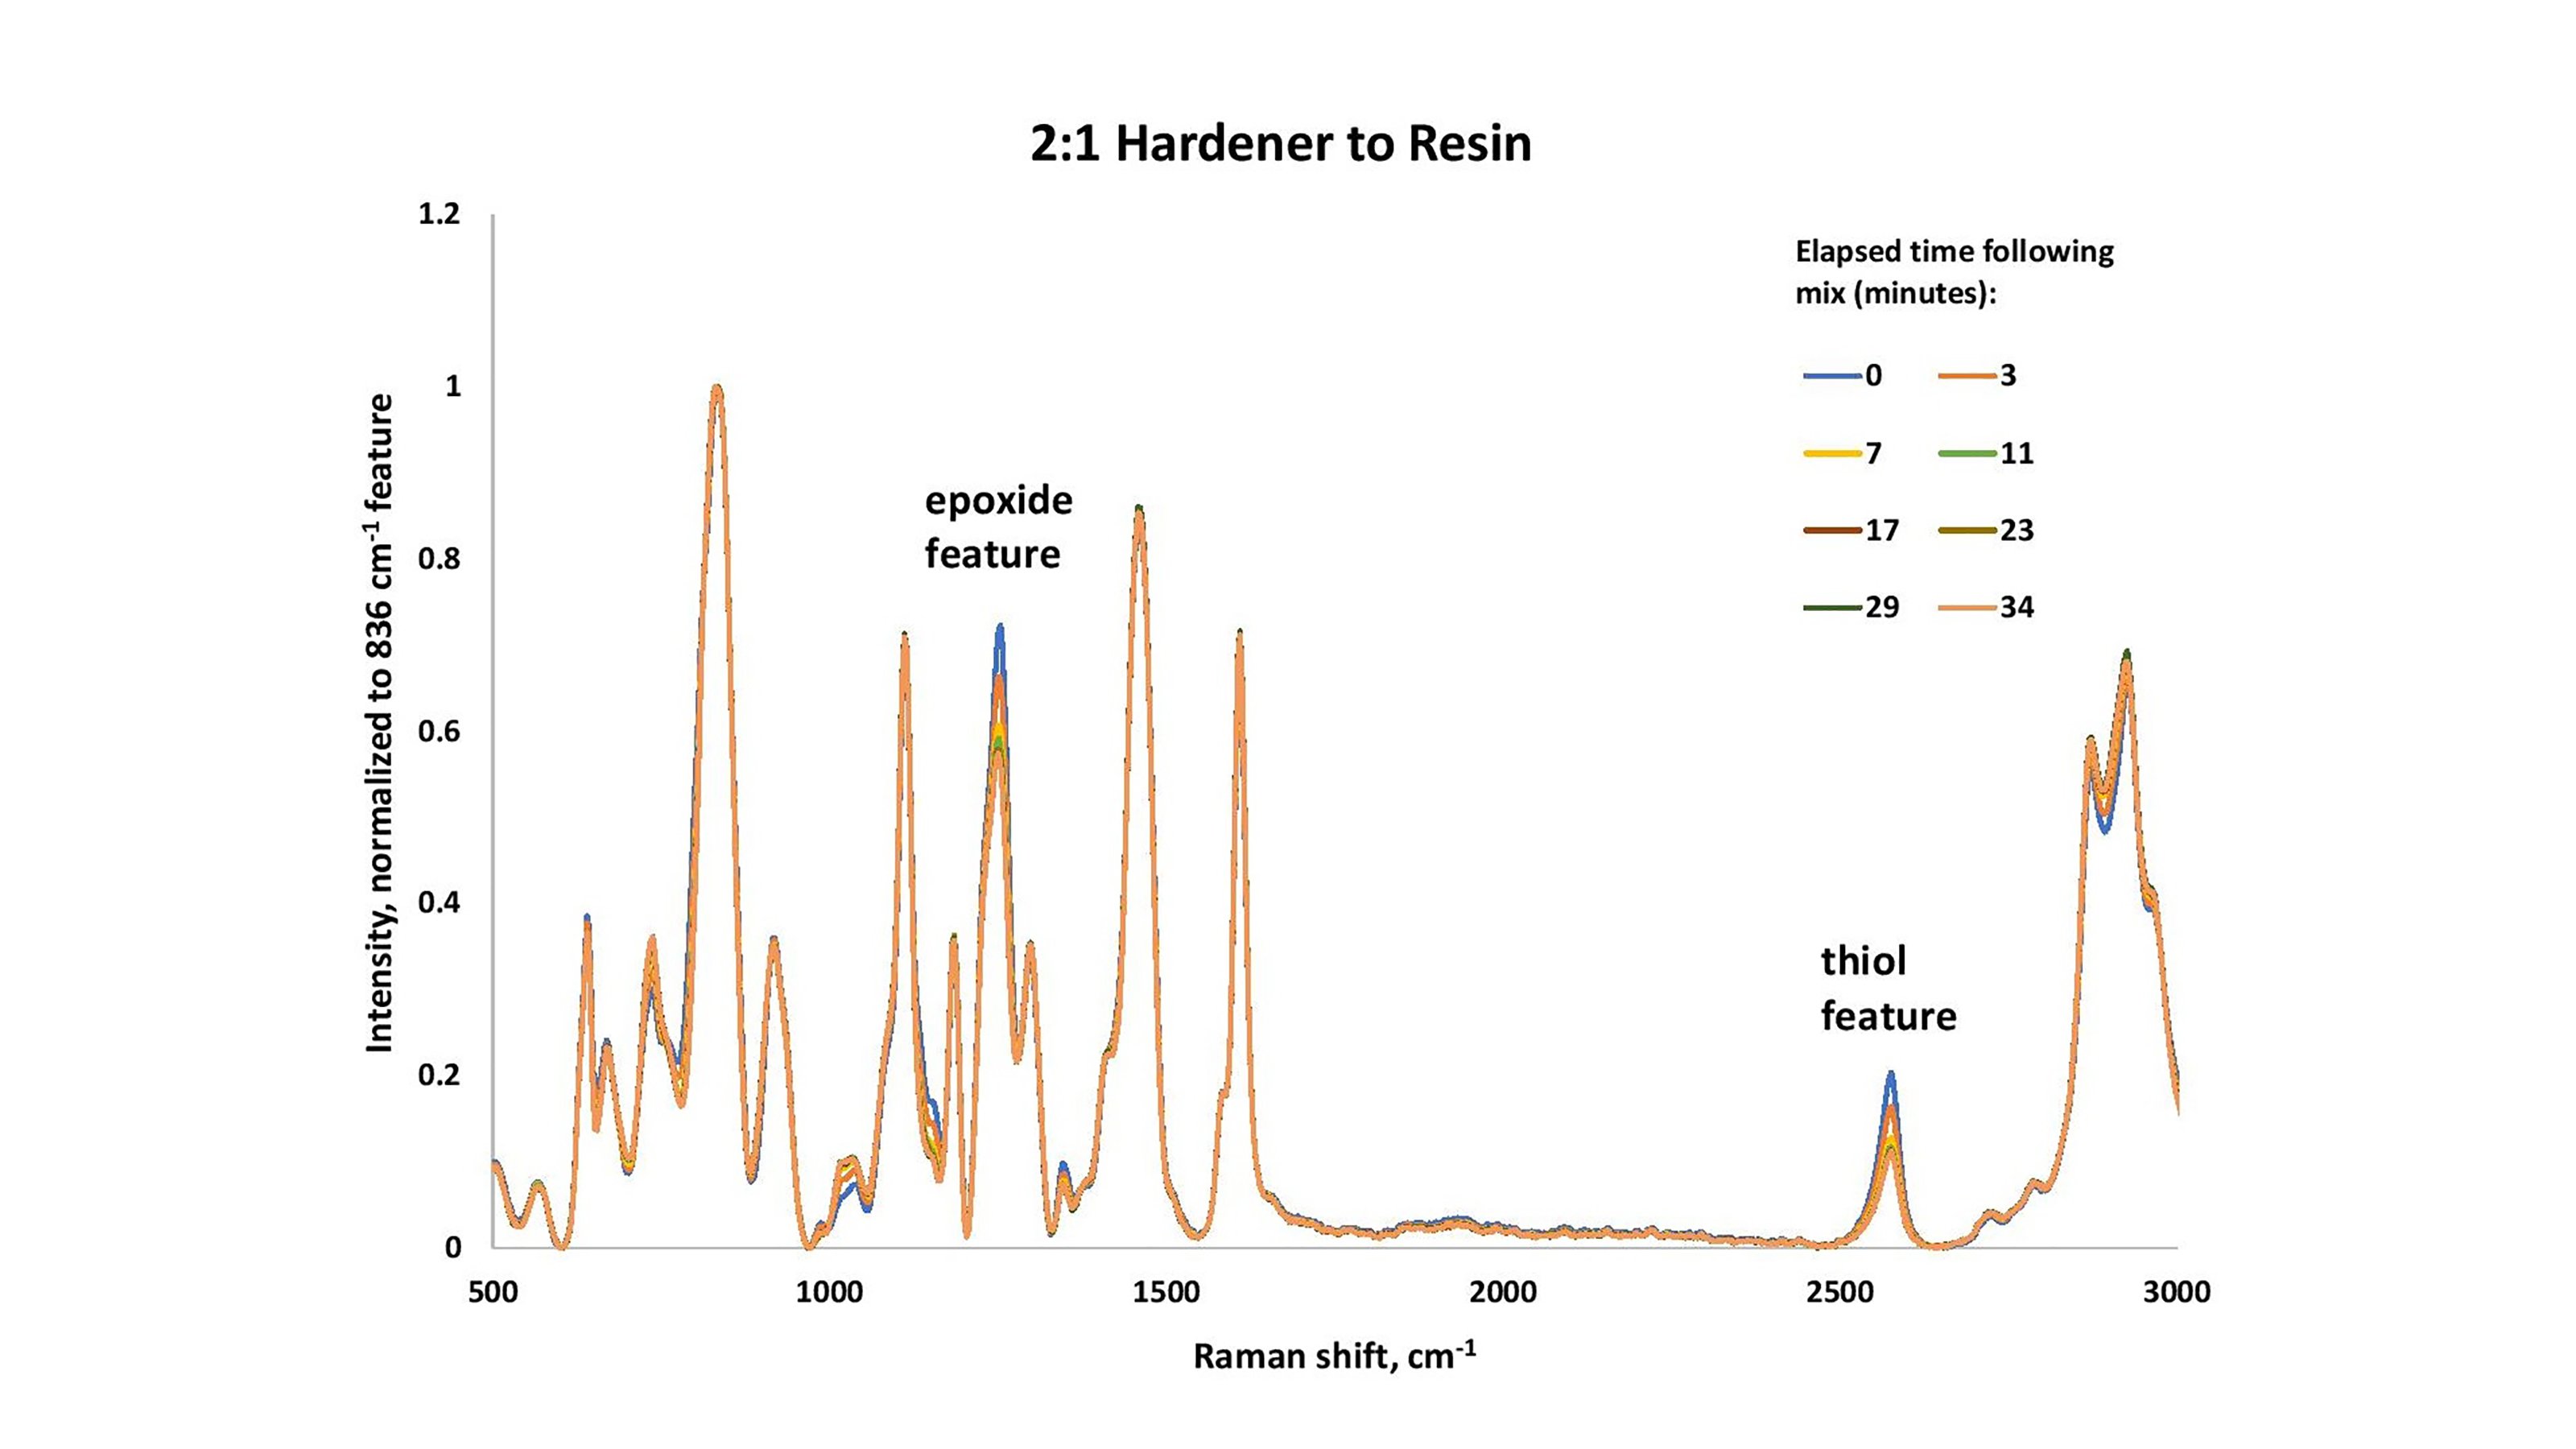
Figure 2. Devcon® 15 Minute Epoxy (1:2 resin to hardener), as a function of cure times (minutes).
A kinetic analysis of the S-H loss is readily performed on the data produced with the Ocean Insight Raman system.
Behavior as a function of time of the S-H feature is shown in Figure 3. A visual comparison of the two data traces (markers) shows that first, there is more S-H at the beginning of the process in the case of the 2:1 hardener-to-resin mix than in the 1:1 case.
Additionally, the data markers show that onset of the reaction is slightly accelerated when excess hardener is present. Fitting the data in the region where S-H reactivity is the fastest (excluding the first three points in the 1:1 case) to a simple exponential with an offset (eq. 1), it is apparent that the kinetics of the bulk of the reaction are the same in both mixtures with τ (1/e half-life) of 4.5 minutes. Finally, it is also clear from the tail of both sets of data (markers) that more unreacted S-H remains in the case where more hardener has been added, which is reasonable because the hardener is the source of the thiol.
Equation 1. y = y0 + A * exp [-(x-x0)]/τ
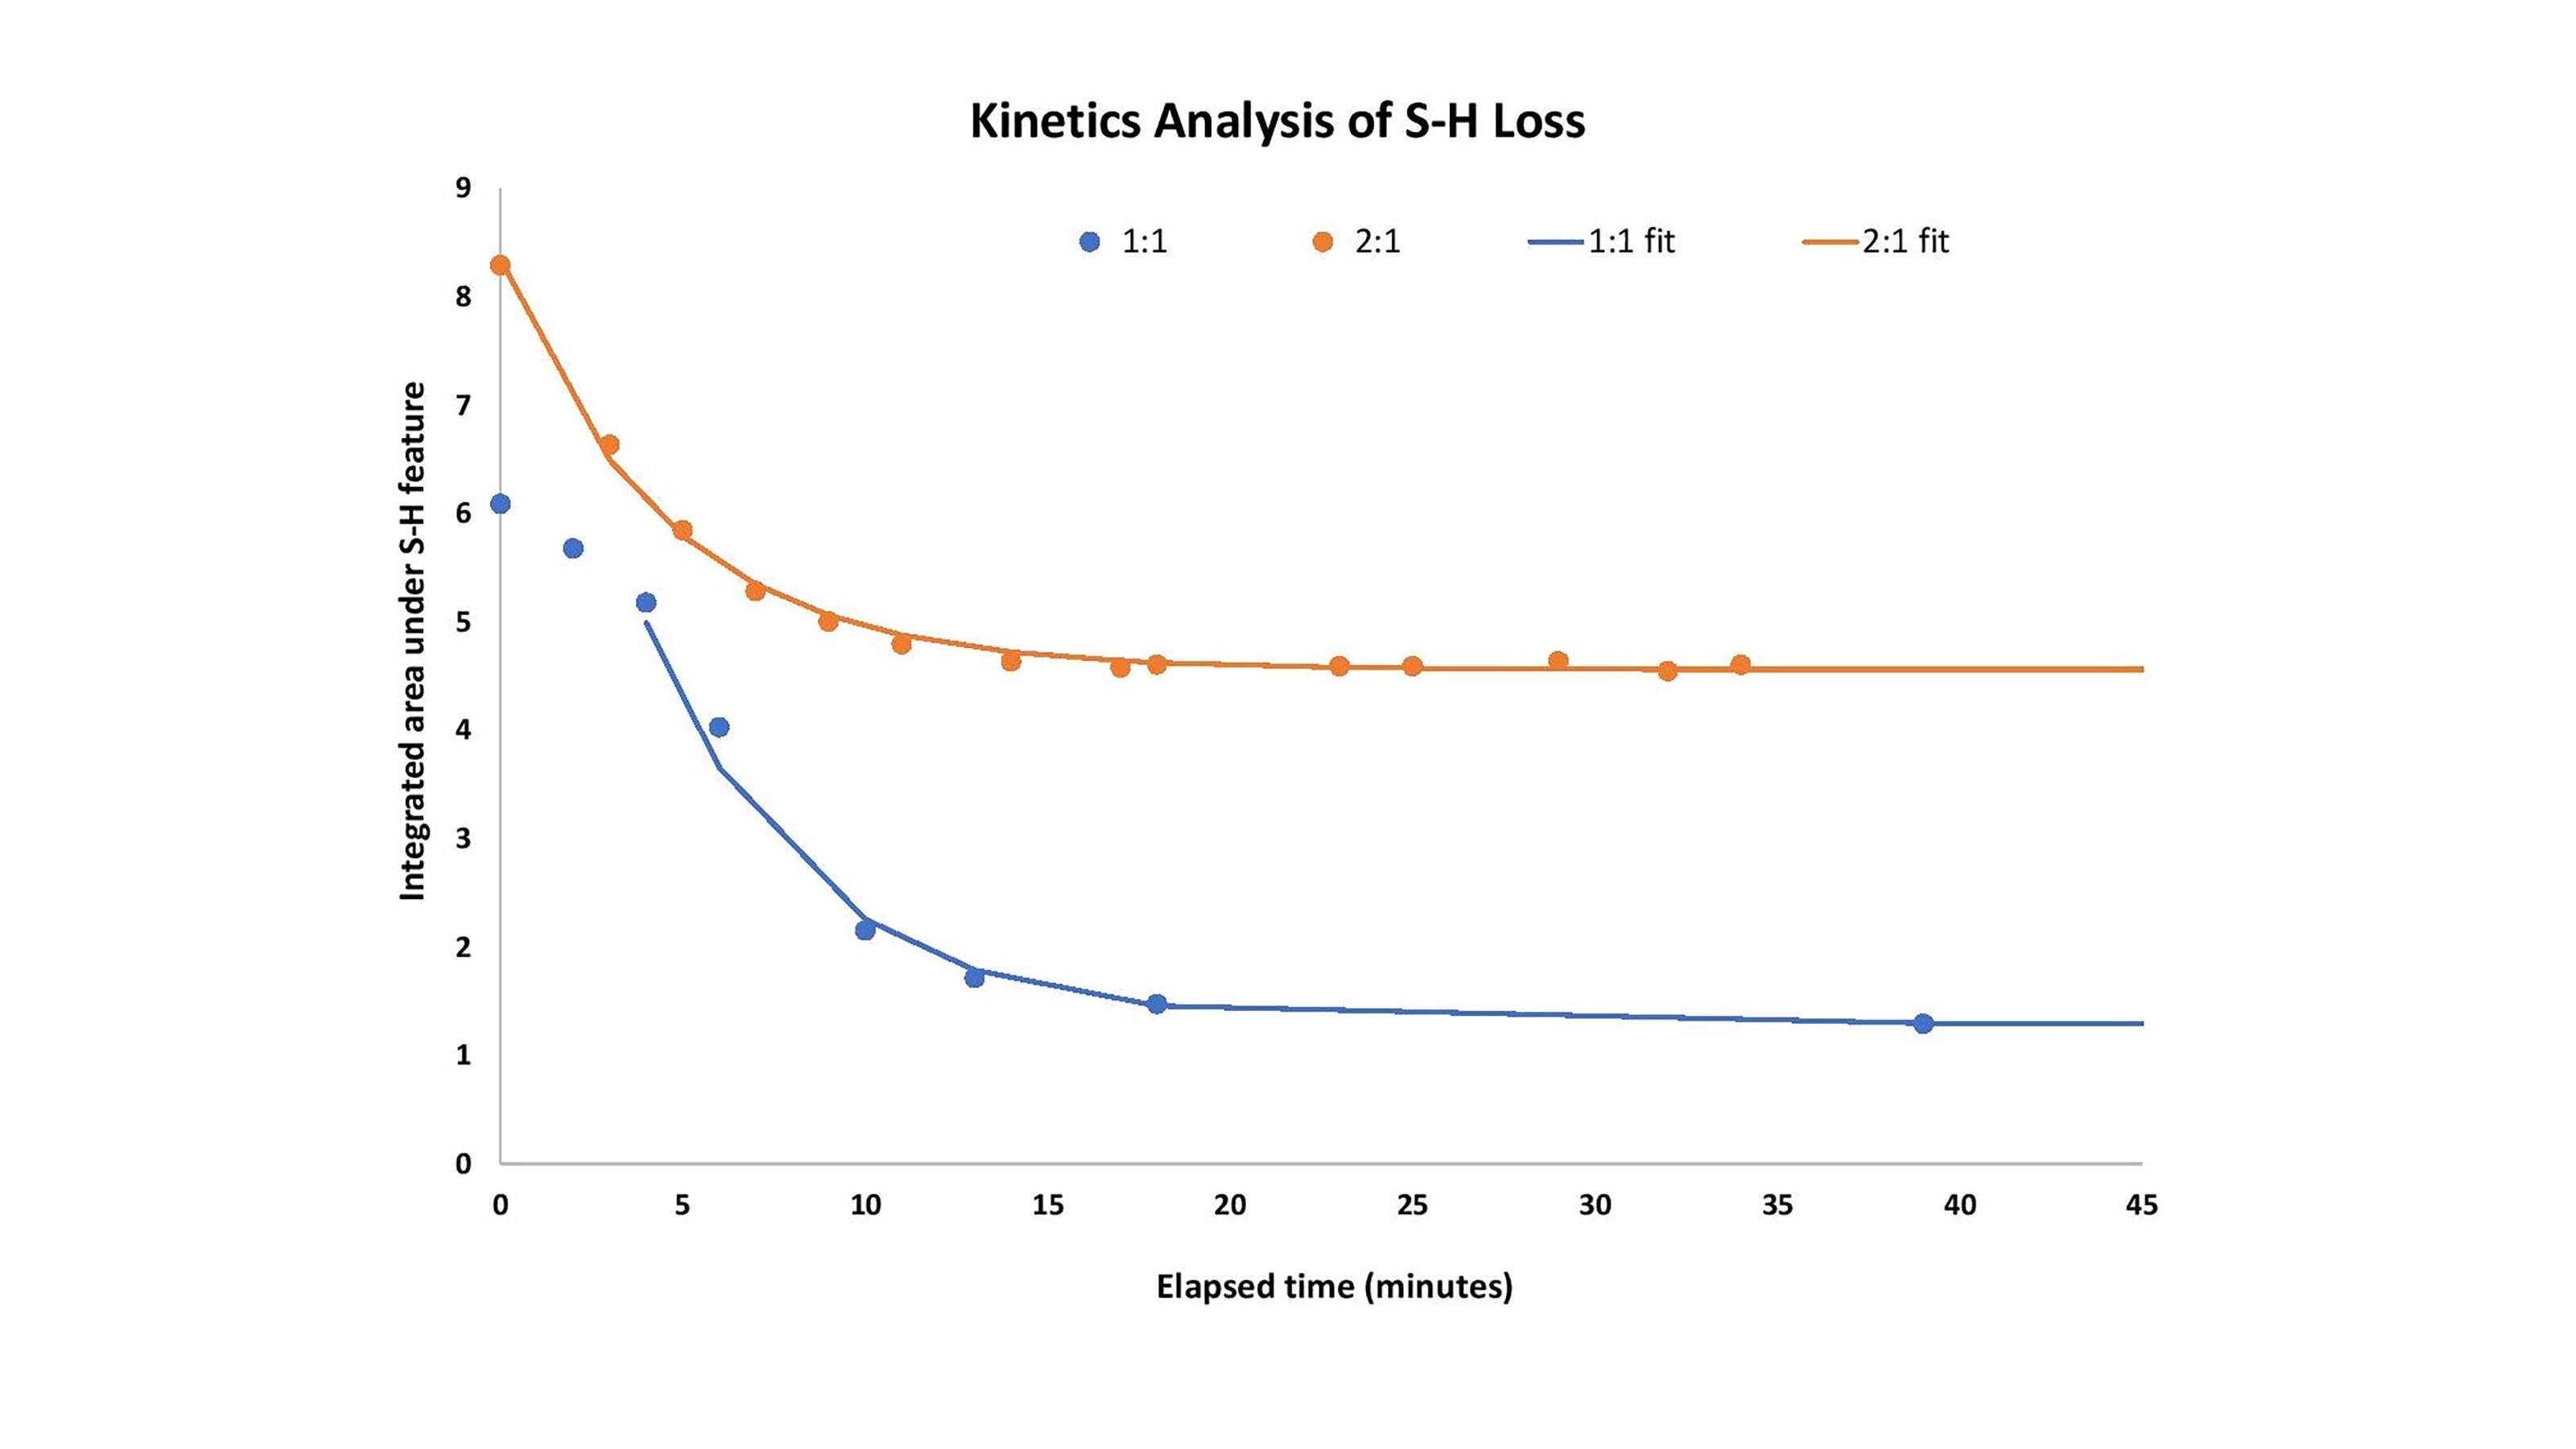
Figure 3. Integrated areas under the S-H feature in both the described cases; also, the exponential fits to the data.
This brief application note details the use of Raman spectroscopy to elucidate details of the epoxy curing process in real time. This utility can be extended easily to other types of reactive processes, even those that are faster than this relatively slow epoxy vitrification. Ocean Insight supports a line of Raman spectrometers and lasers that are ideal to perform this type of analysis, and the applications expertise to help you solve similar problems.
Download a PDF version of this application note.

1. Křesálek, V. and H. Vašková, “Raman spectroscopy of epoxy resin crosslinking,” Recent Researches in Automatic Control, Conference Paper, May 2011.
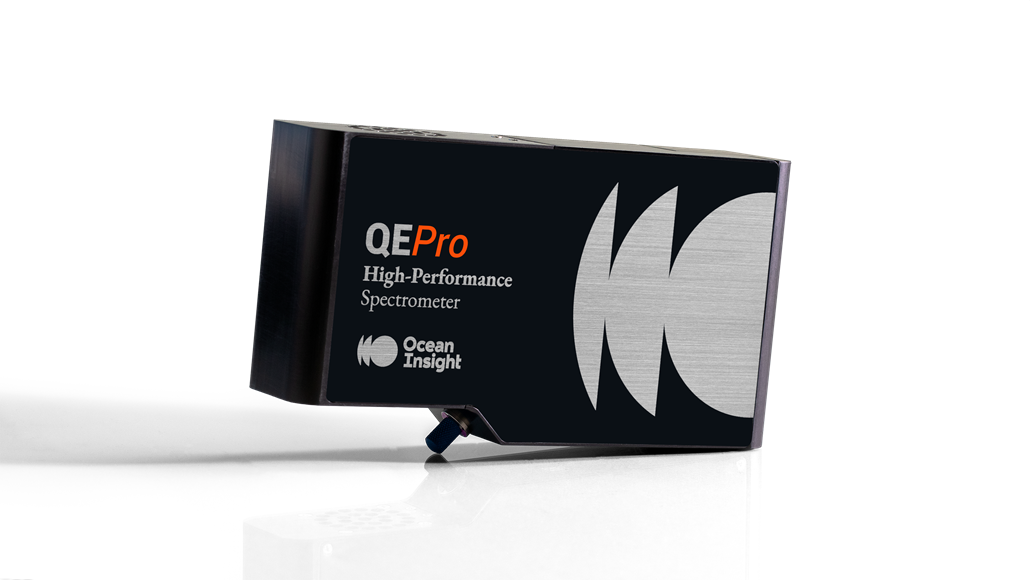
QE Pro Preconfigured Raman Spectrometers
Ocean HDX 785 Preconfigured Raman Spectrometers
Options available
785 nm Raman Lasers
Prices From $8,818.00
Raman spectroscopy uses scattering of laser light to probe molecular structure. Of every million photons scattered, a single photon will interact with the vibrational states of a sample molecule and emit light of a different wavelength.

Learn more tips from Ocean Insight's Dr. Amy Bauer and others on Raman spectroscopy and its applications in the Raman episode of our Applied Spectral Knowledge podcast series.
We offer suggestions for making sense of the sharp peaks and jagged shapes you’ll find in Raman spectra. Raman signatures can be used as is or matched to a known database for materials identification.

Receive updates from our team as we share application notes, customer spotlights, educational tools, spectroscopy how-to’s, and more.