
Subscribe to Our Blog
Receive updates from our team as we share application notes, customer spotlights, educational tools, spectroscopy how-to’s, and more.
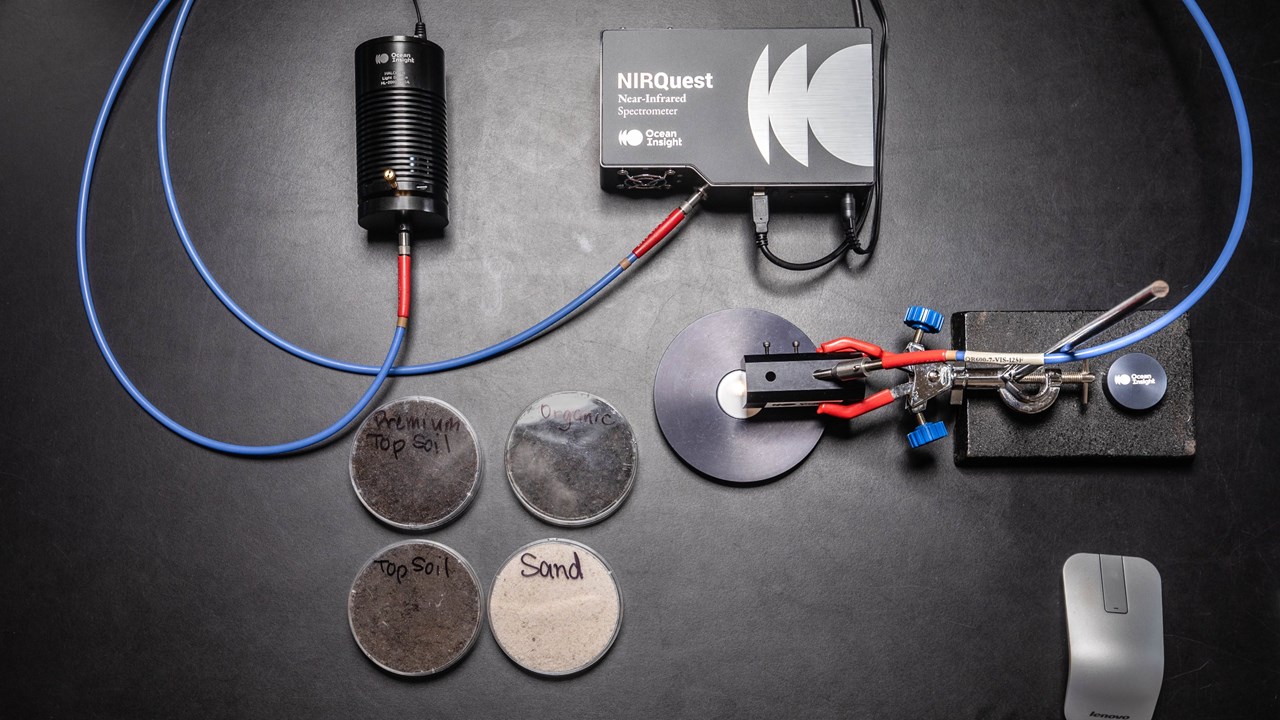
In this post, we share spectra of various soil samples as measured with the NIRQuest+ spectrometer (900-2500 nm). NIRQuest+ is distinguished by its high sensitivity and great thermal stability.
In this experiment, we identified the moisture content of organic and topsoil samples using the NIRQuest+2.5 spectrometer (900-2500 nm) as part of a diffuse reflectance system.
Determining moisture content in soil has great significance in agriculture, where crop health is largely dependent on maintaining optimal moisture levels, which vary by factors such as the soil and crop type.
We collected four different samples from a local garden center: standard top soil, premium top soil containing compost, compost, and sand.
Samples were removed from each bag, weighed and measured. These samples were labeled as Wet Soil (Figure 1). Note the two strong moisture peaks. Absorption bands for water typically are seen at 970 nm, 1200 nm, 1450 nm and 1950 nm.
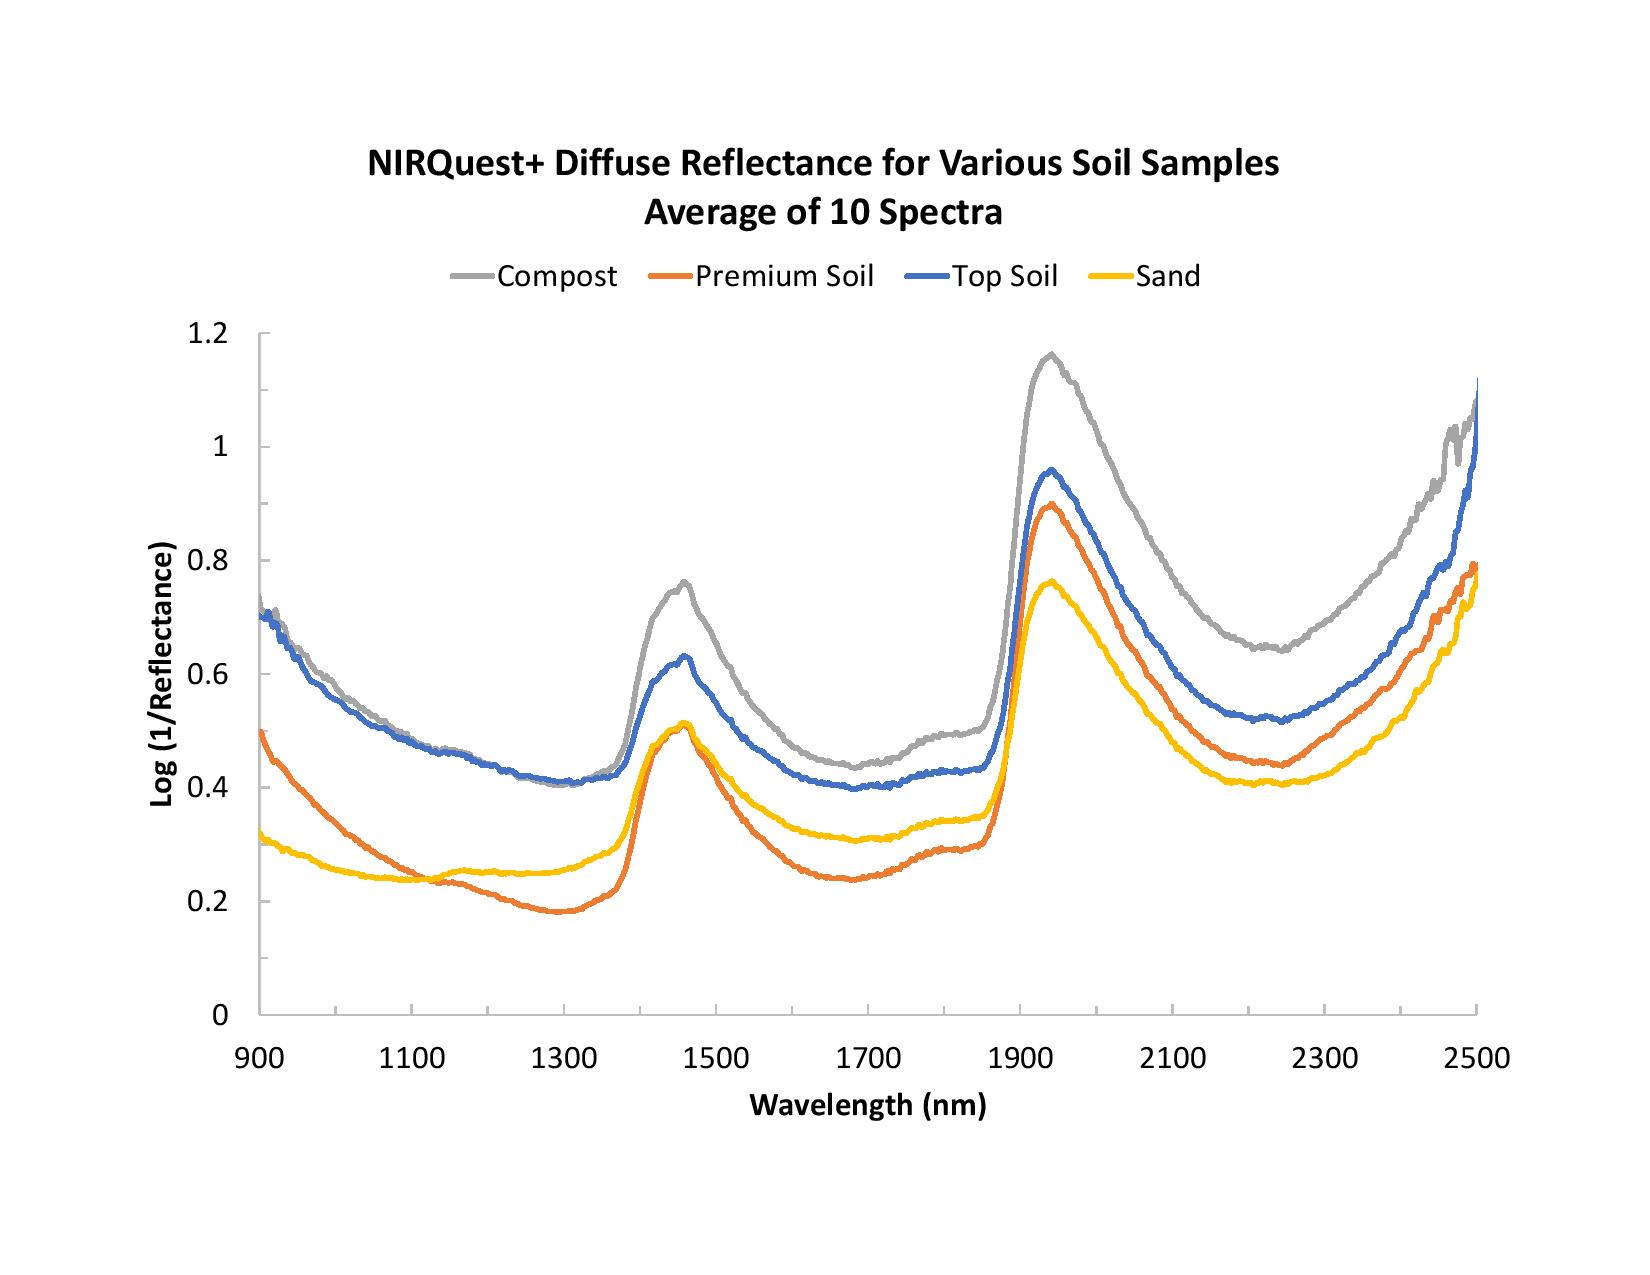
Figure 1. Samples comprising topsoil, compost and sand initially were measured with no sample preparation.
Although the data were collected using diffuse reflectance techniques, we plotted the spectra as absorbance (Log (1/Reflectance). This is because observing the trend in intensity/absorbance is more intuitive than observing the plots as %Reflectance.
Next, we put the samples into a drying oven at 100 °C for two days, weighing and measuring the samples again to determine the moisture content for each. These samples were labeled as Dry Soil. Once the samples were dried, the moisture peaks were not nearly as strong. Still, in our humid Florida environment, the dried samples absorbed at least some water, which is evident in the spectra (Figure 2).
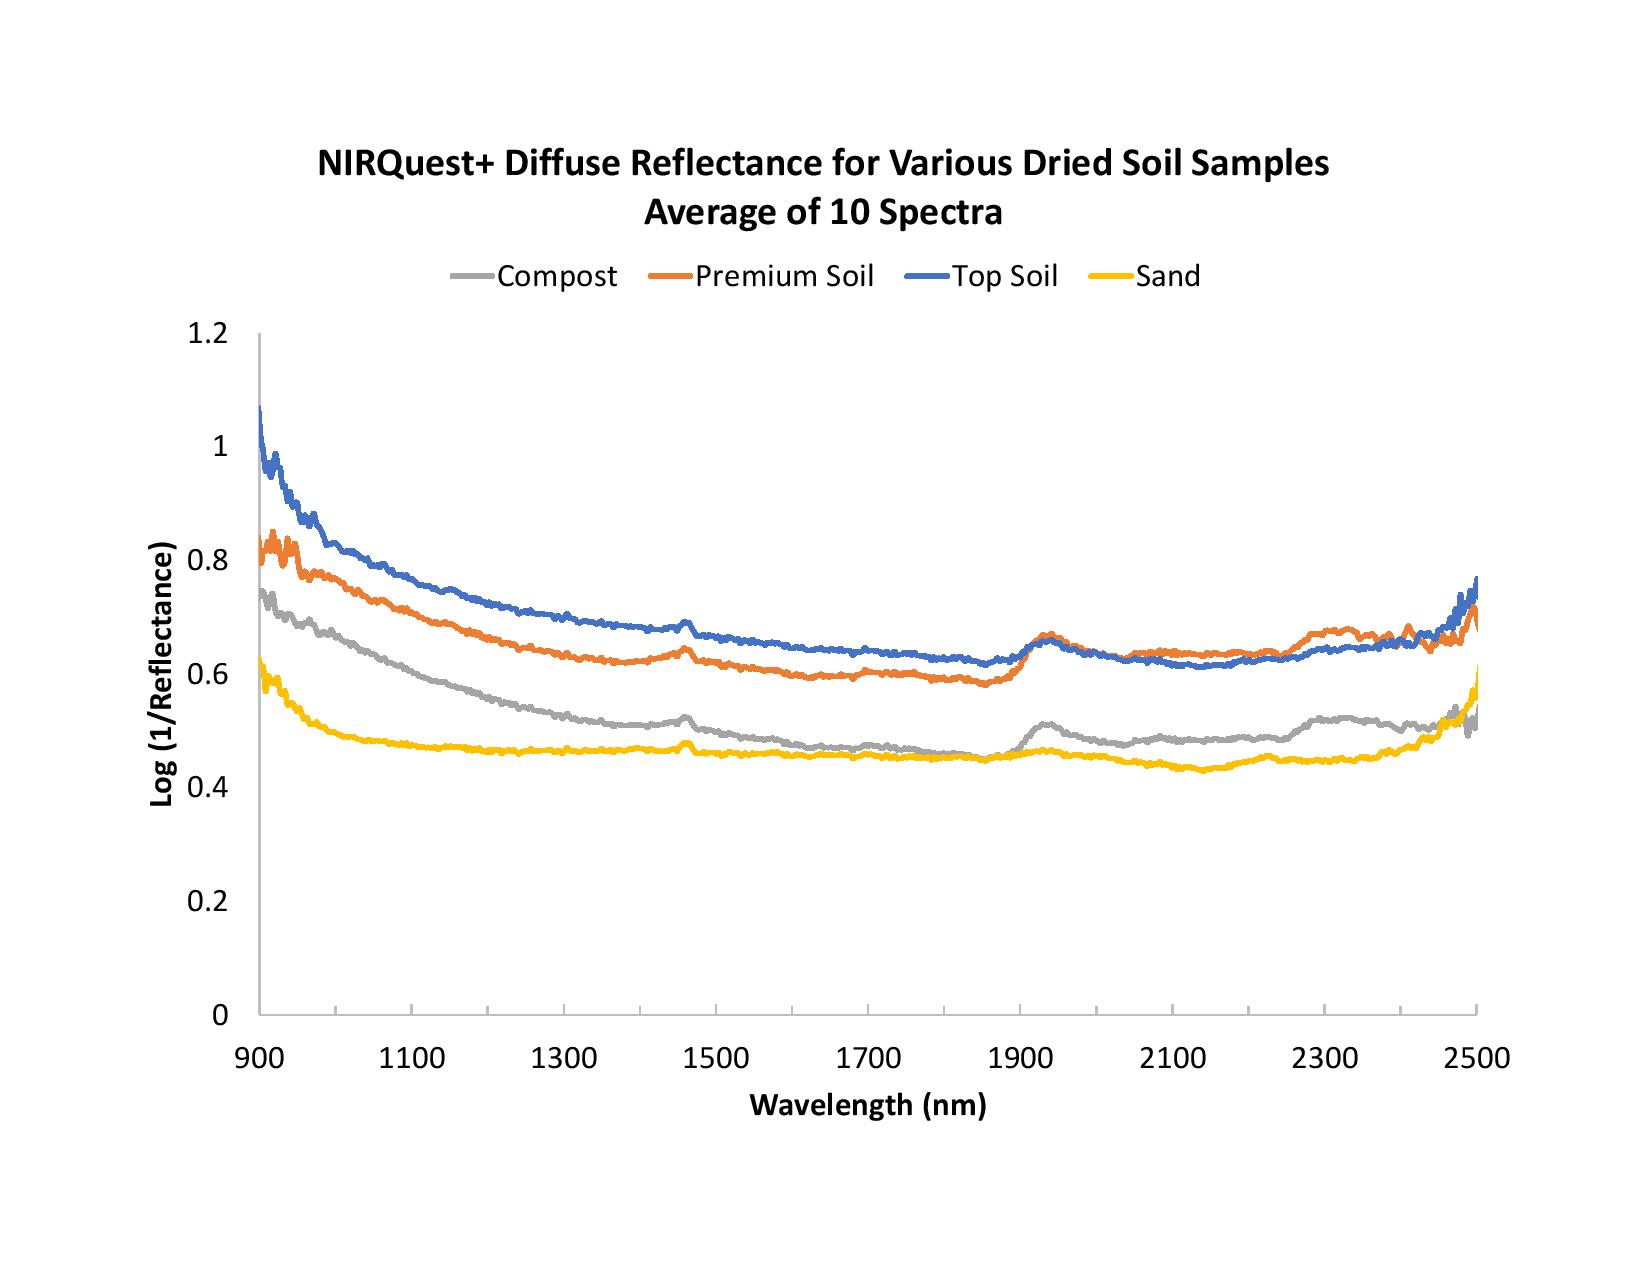
Figure 2. Even after oven drying for two days, the samples revealed characteristic moisture features.
Figure 3 shows a data plot that has been baseline corrected. As you’ll see, the trend in the reflectance at the two water peaks follows the trend in moisture we determined for our soil samples.
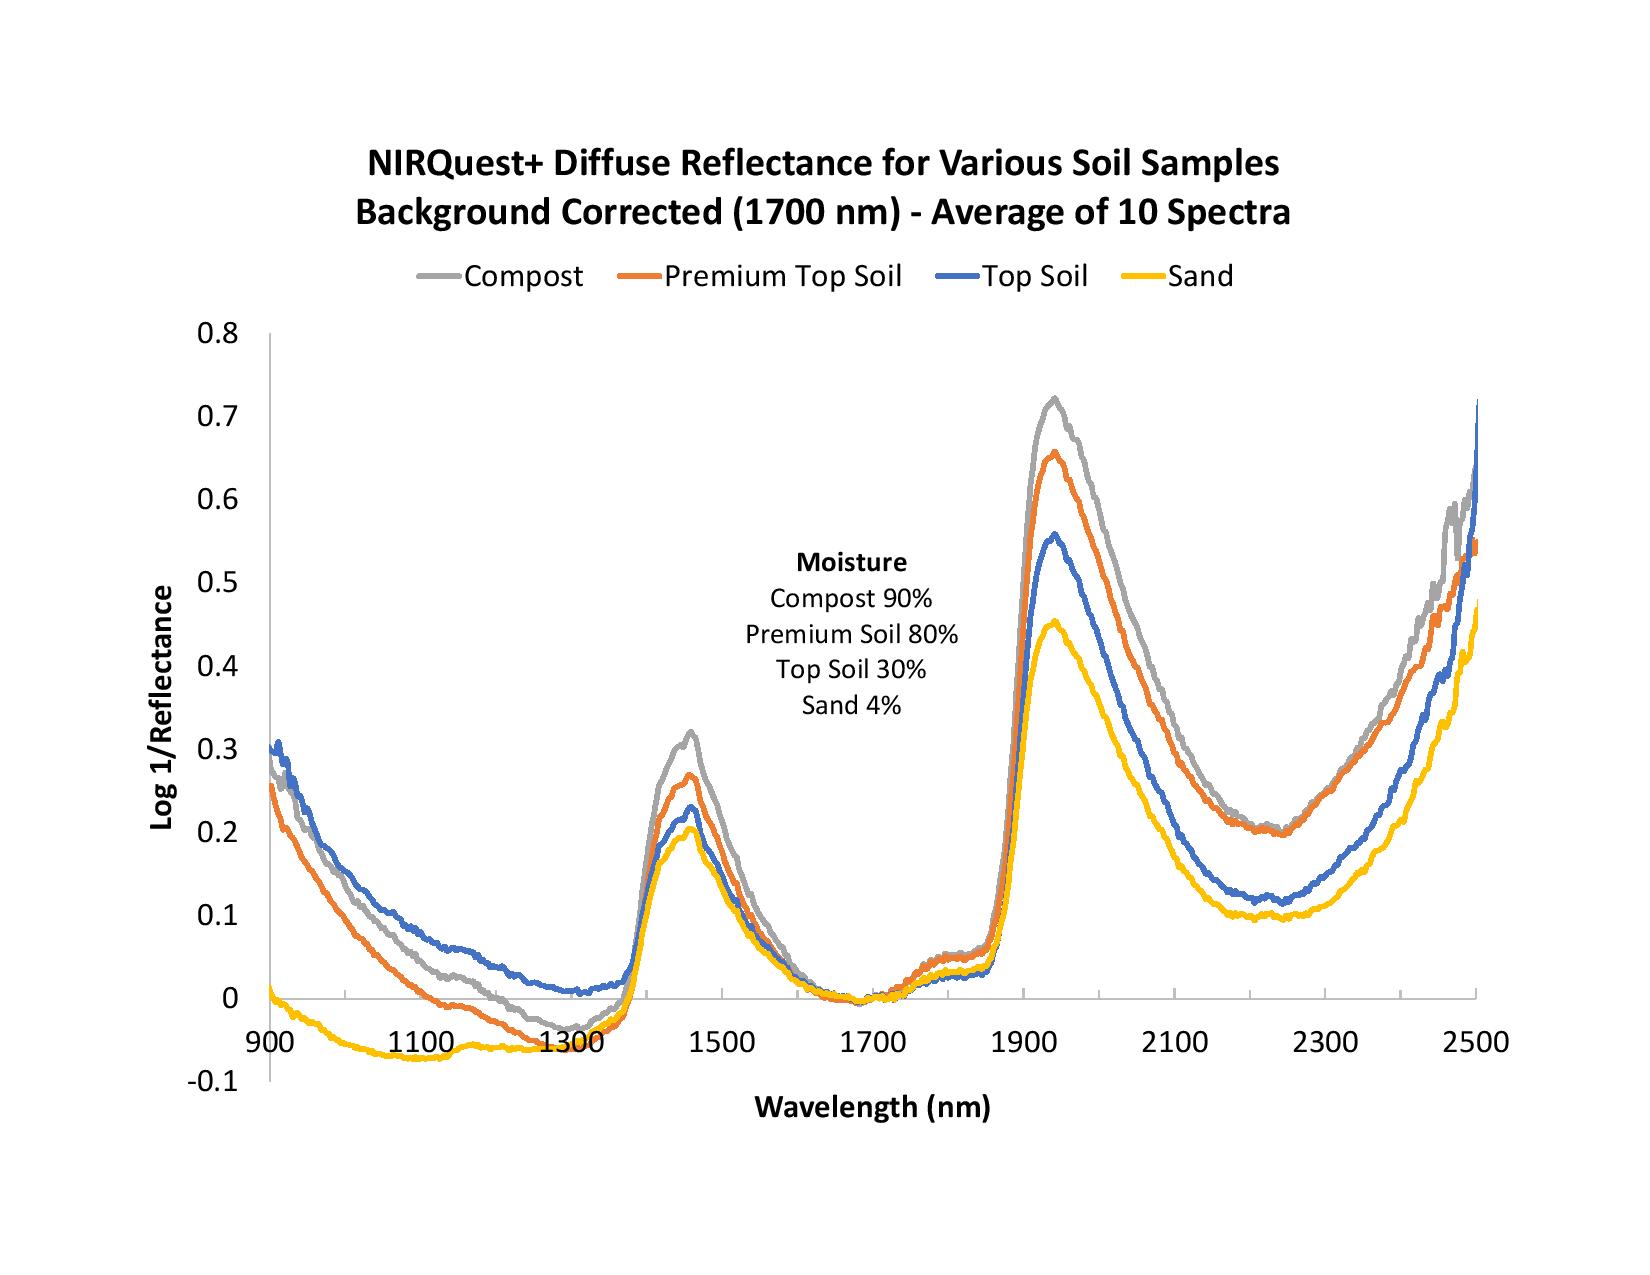
Figure 3. These spectra have been baseline-corrected to better demonstrate spectral trends.
By applying machine learning tools and algorithmic modelling, additional insights could be gleaned from the moisture content spectral data and other characteristics of soil samples.

Measuring soil composition with a near-infrared diffuse reflectance system helps characterize soil quickly, economically and effectively. In this demo, we use the NIRQuest+2.5 NIR spectrometer as part of a diffuse reflectance system for soil analysis.
With NIRQuest+, you'll enjoy a 2.5x increase in sensitivity, greater thermal stability, and low limits of detection from 900-2500 nm.
Find the best Ocean Optics NIR spectrometer to meet your price and performance criteria. We have options at every level.

Listen to our experts cover topics including the advantages of NIR spectroscopy, applications that benefit from NIR techniques, and where future NIR developments may take us.

Receive updates from our team as we share application notes, customer spotlights, educational tools, spectroscopy how-to’s, and more.