Subscribe to Our Blog
Receive updates from our team as we share application notes, customer spotlights, educational tools, spectroscopy how-to’s, and more.
In this application note, we use a high-speed Ocean FX spectrometer to measure flicker, color and other spectral characteristics of incandescent and LED holiday lights.
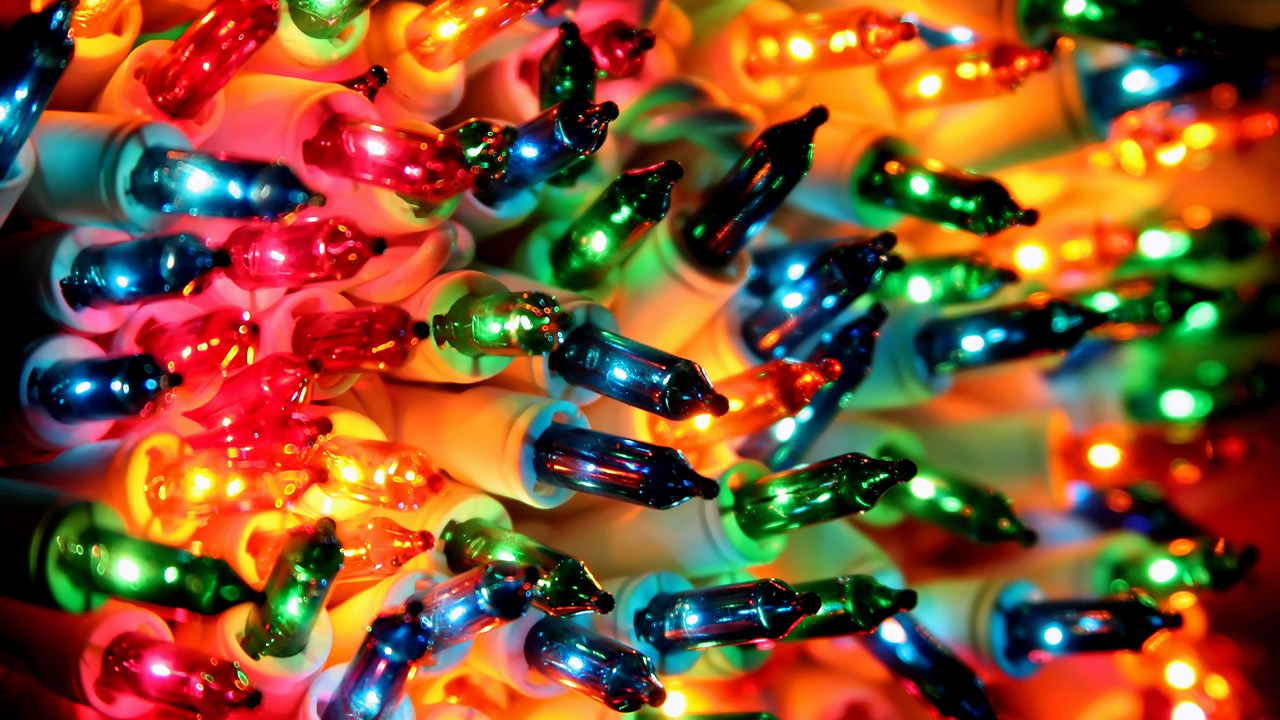
During the holiday season, mesmerizing light shows and magical holiday scenery fill the world around us. Colorful, twinkling lights abound, filling the world with a festive, joyous atmosphere. It’s the perfect time for the spectroscopy of Christmas lights.
LEDs have become the holiday lighting of choice, thanks to their low power requirements, high efficiency and bright colors. Yet we can’t help but wonder how LEDs compare to incandescent holiday lights. More efficient holiday lighting may not be the first requirement on everyone’s list. Here’s what we discovered while characterizing the irradiance, flicker and color of multicolor LED and incandescent holiday lighting.
We tested strings of 20 multicolored incandescent and LED lights using an Ocean-FX-VIS-NIR spectrometer (350-1000 nm), a FOIS-1 integrating sphere, 600 µm Vis-NIR optical fiber and OceanView spectroscopy software (Figure 1). Spectral data was acquired for three bulbs of each color from each string in absolute spectral radiant flux (uW/nm) with the HL-3P-INT-CAL radiometrically calibrated light source as the reference. Using the processed mode in OceanView, we corrected the spectral data for the instrument response function of the Ocean FX spectrometer, with intensity reported as power in microwatts per nanometer (uW/nm).
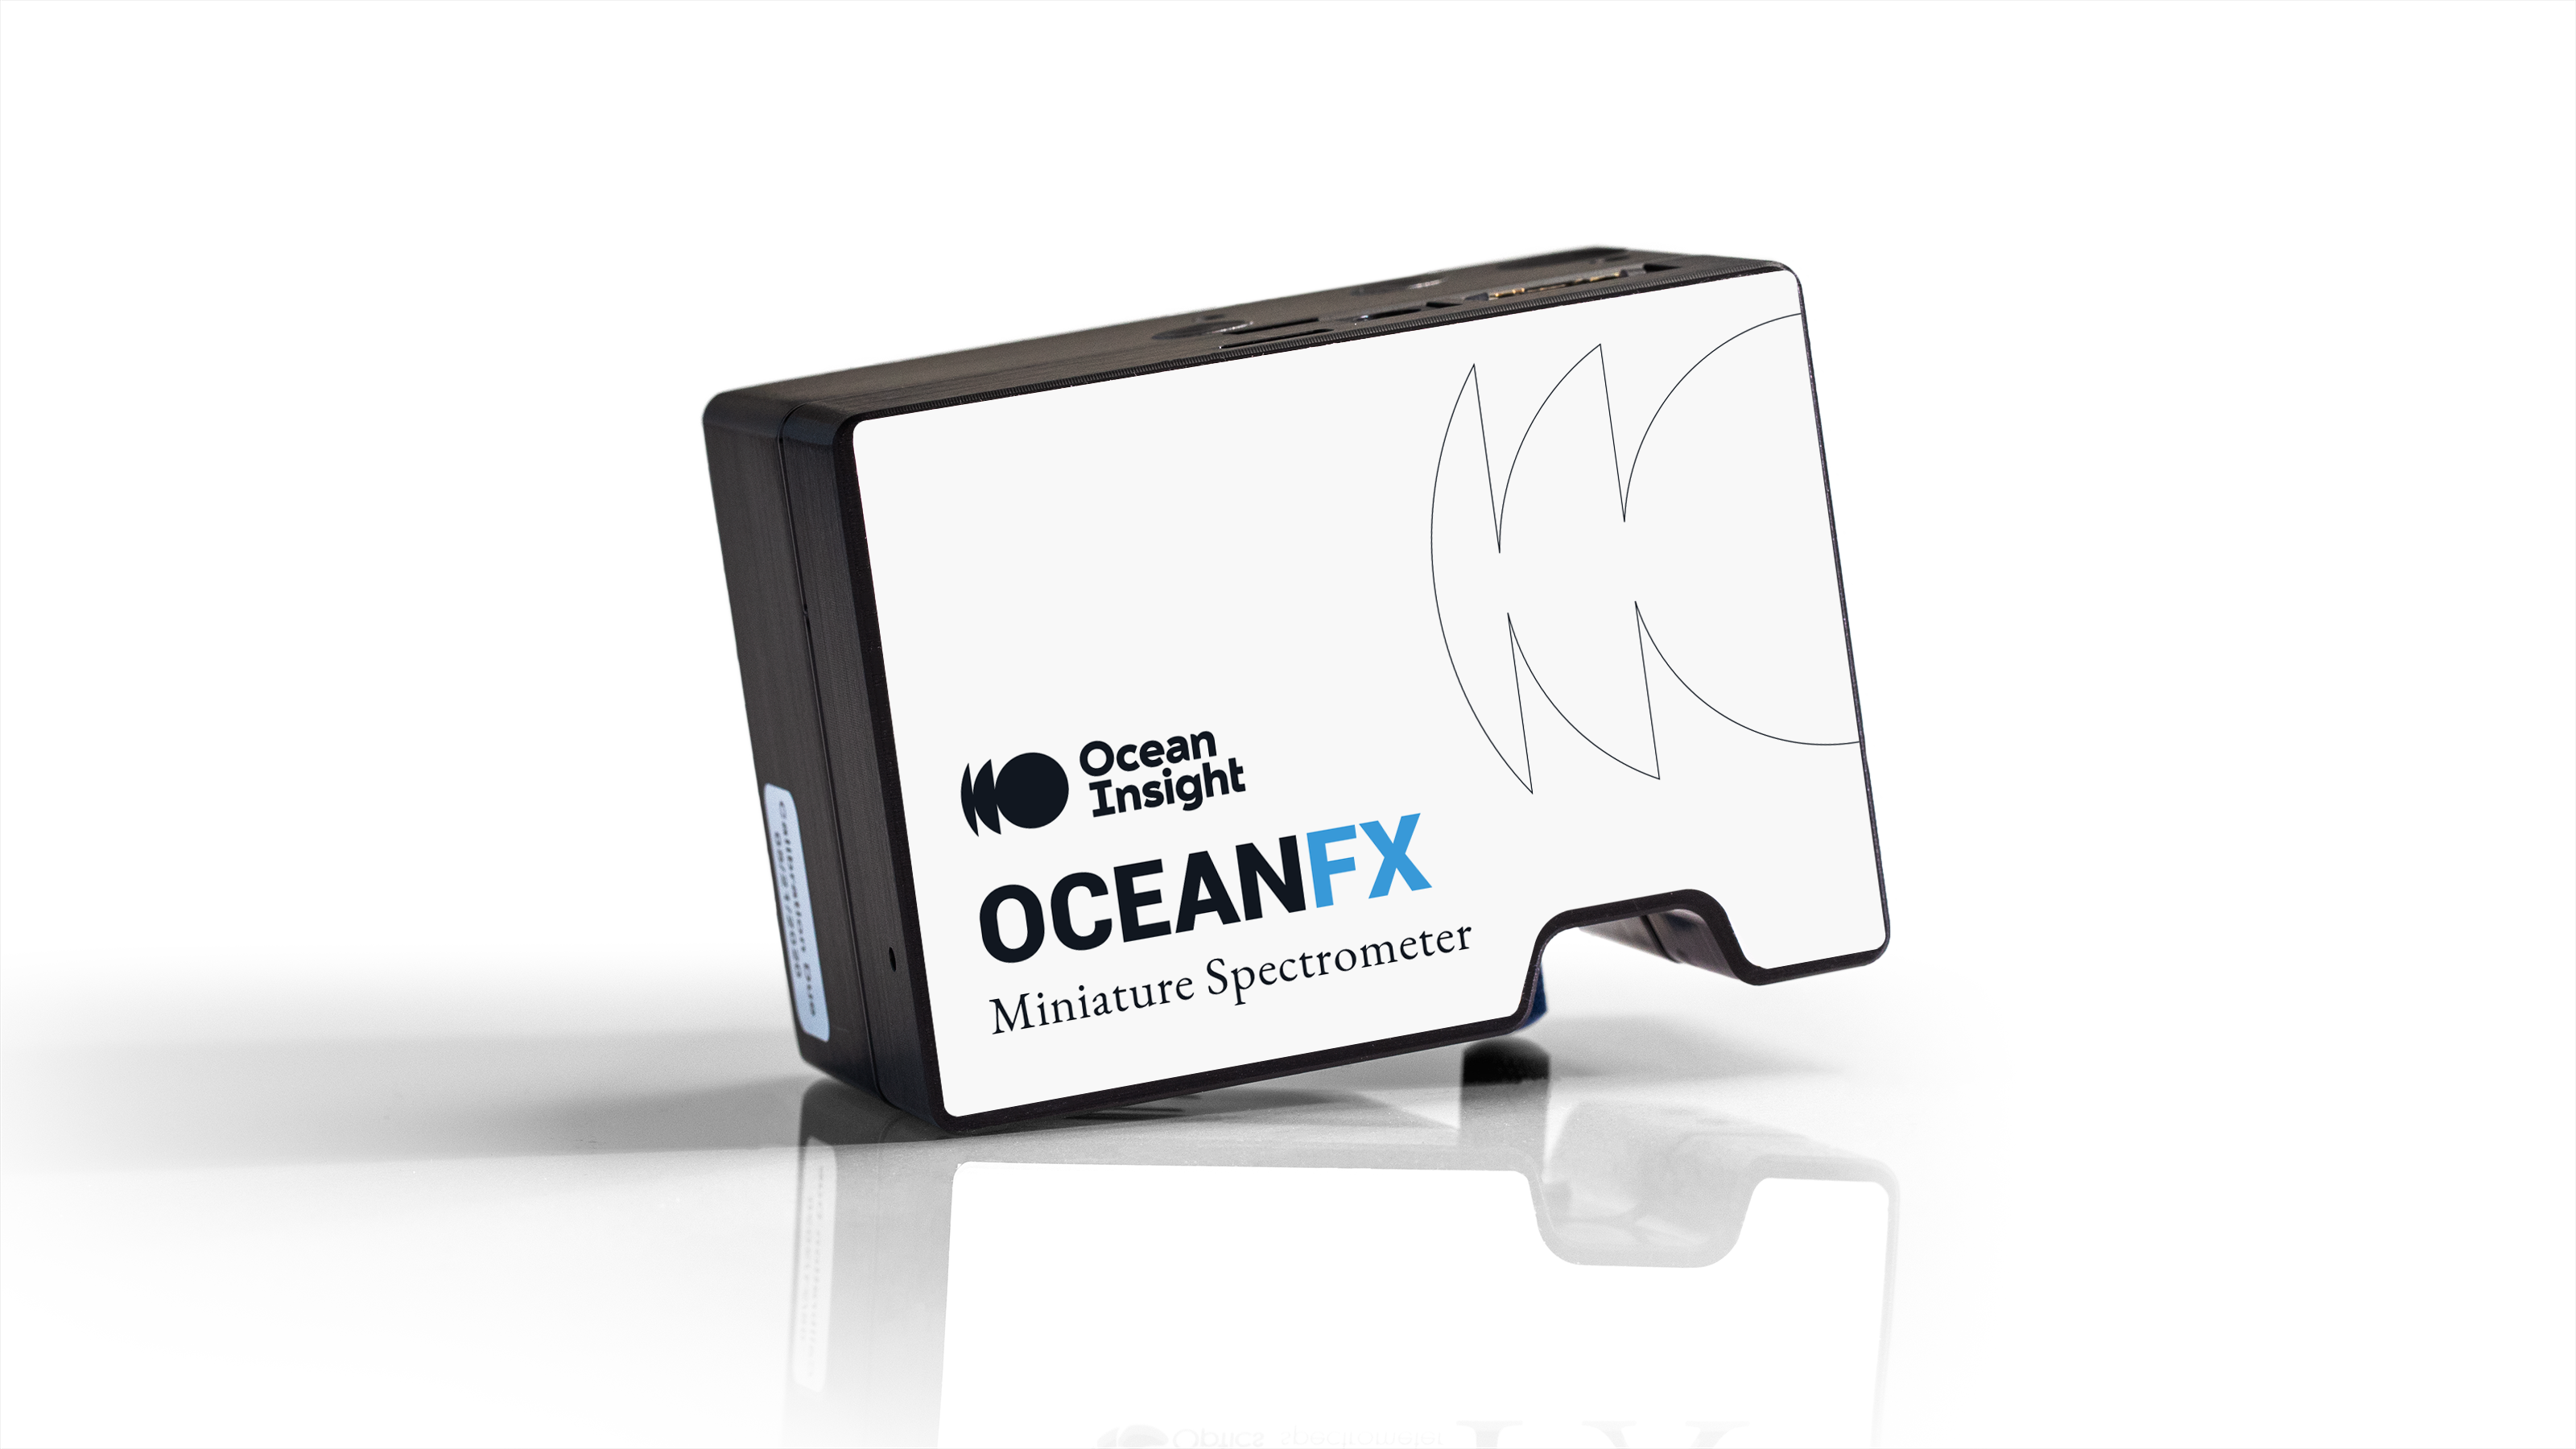
Figure 1. Because it can acquire up to 4,500 scans per second, the Ocean FX is ideal for measuring the rapid occurrence of flicker in lighting.
We chose the Ocean FX because its fast electronics enabled us to measure super-bright LED holiday lights without saturating our detector. Also, the spectrometer’s high acquisition speeds allowed us to qualitatively assess flicker – a change in brightness over time typically related to fluctuations in the power source -- of a blue bulb from each string of lights. Quantitative color measurements also were made for each color of the LED and incandescent light strings.
The incandescent Christmas lights we measured had broadband spectra with the highest intensity in the shortwave NIR region >700 nm (Figure 2). The light at these wavelengths is beyond the range of human visual perception and produces heat, causing the bulbs to warm up during operation. In fact, according to the U.S. Department of Energy, 90% of the energy emitted by an incandescent bulb is heat.
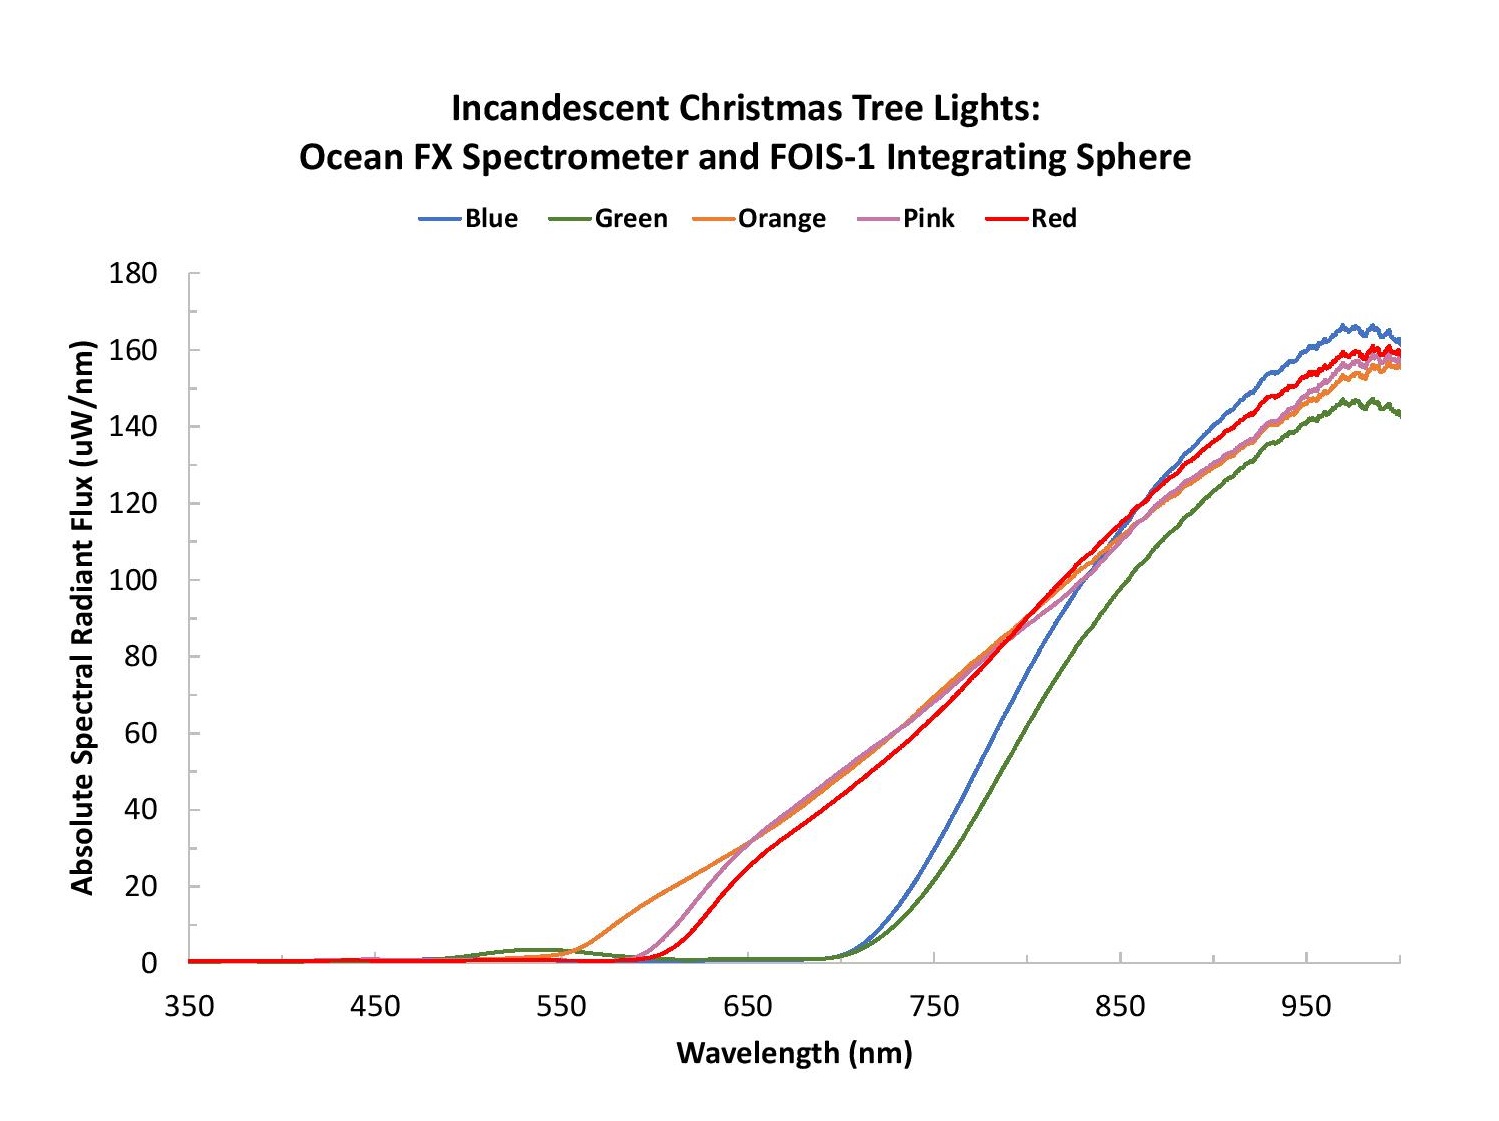
Figure 2. With incandescent lights, heat is generated from the spectral output at wavelengths >700 nm, where spectral intensity is highest.
Also, the spectral profile for the incandescent bulbs looks like the spectra for high pass optical blocking filters. This spectral profile results from the glass shrouds that give the incandescent bulbs their beautiful color. The glass shrouds act as optical filters that transmit the desired wavelength.
The LED light strings that we measured had narrowband emission with no intensity in the shortwave NIR region >700 nm, which allows the bulbs to remain cool to the touch even after long periods of operation (Figure 3). In addition to producing less heat, the LEDs are more energy efficient than incandescent lights. When compared to the power of the incandescent bulbs in absolute spectral radiant flux, the LEDs produced much higher intensity. This difference in intensity occurs because the LED bulbs create color directly from the bulb instead of using a filter to select the desired wavelength from a glowing filament.
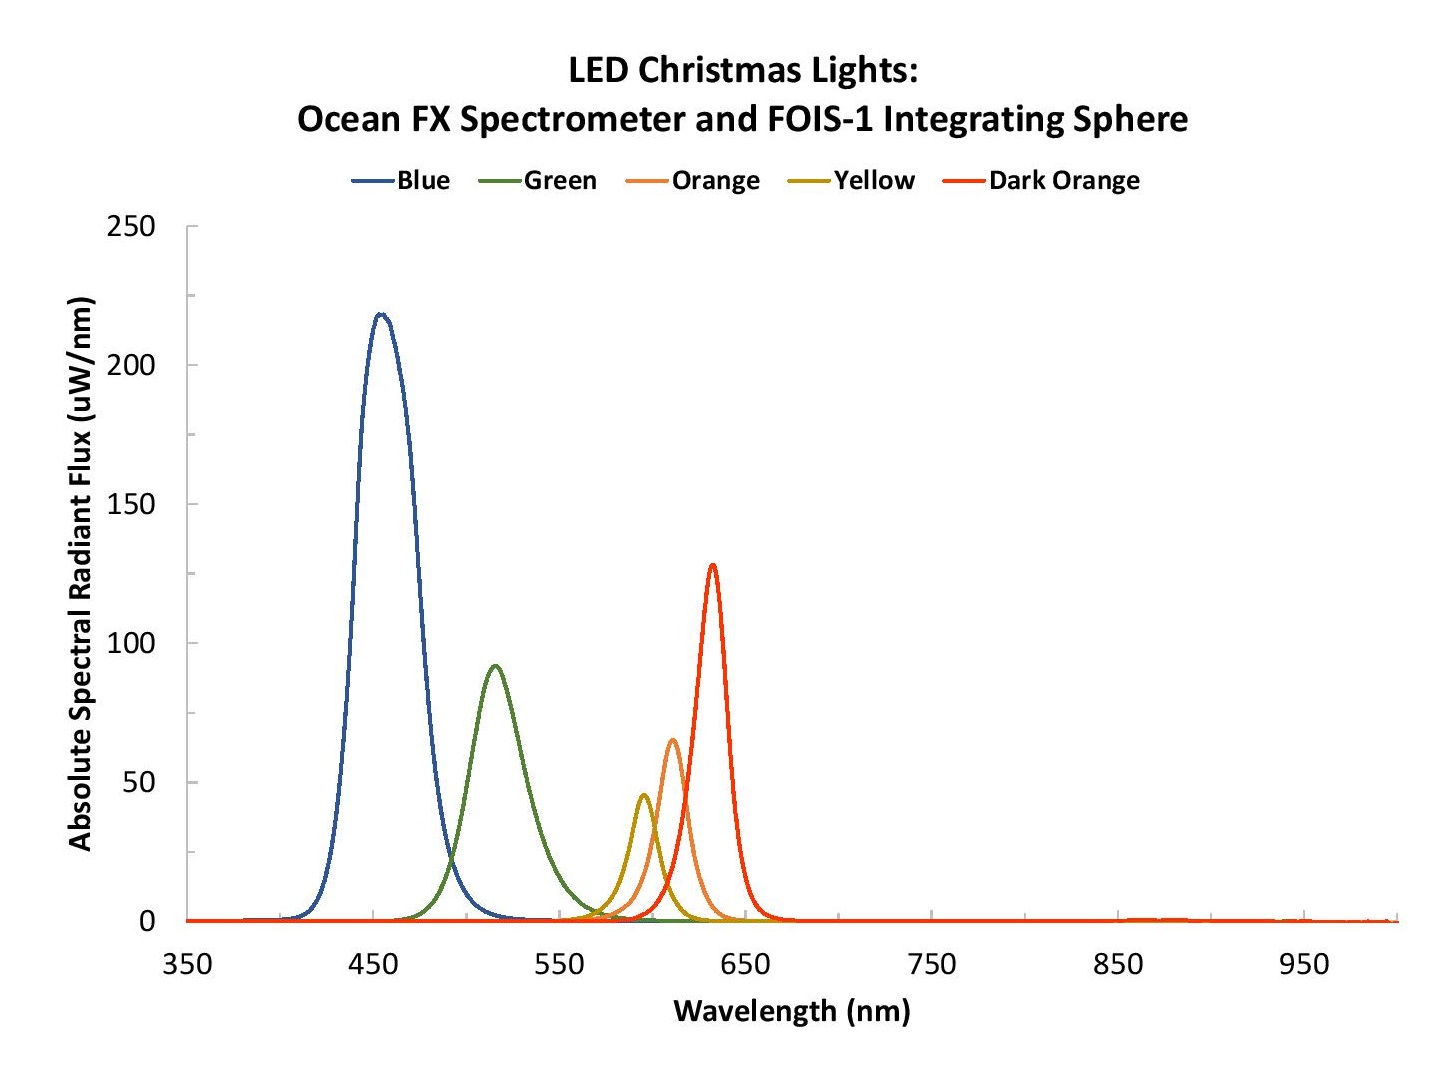
Figure 3. The LED lights we tested had virtually no spectral output >700 nm.
Lighting powered by alternating current (AC) can show fluctuations in intensity related to the AC power frequency. One of the worst offenders is fluorescent lighting, which can have intensity variations of up to 20%. This may explain why we tend to prefer natural lighting. Even though the eye doesn’t register intensity fluctuations at frequencies below 70 Hz, frequencies of up to 200 Hz can lead to eye strain and headaches for some, and poorer performance on visual tasks in others. In some cases, lighting flicker can even cause seizures, nausea and other health effects.
One of the challenges in studying flicker has been the lack of instrumentation capable of characterizing light sources on the time scale of the flicker (often faster than the eye can perceive). With the Ocean FX, we can capture a full spectrum (350-1000 nm in this study) at the rate of 4,500 scans per second, enabling us to characterize flicker not perceptible to the human eye.
Flicker was characterized for blue bulbs from the incandescent and LED light strings. (Unlike some holiday lights, our lights were not designed to blink). Even though no flicker was observed visually, the spectra in Figures 4-5 show a dramatic difference between the incandescent and LED bulbs; for example, observe the disparate y axis ranges in each figure. The intensity variations measured for the bulbs are significantly different, with the blue incandescent bulb showing fluctuations from 1-1.75 uW/nm and the LED showing fluctuations from 0-700 uW/nm.
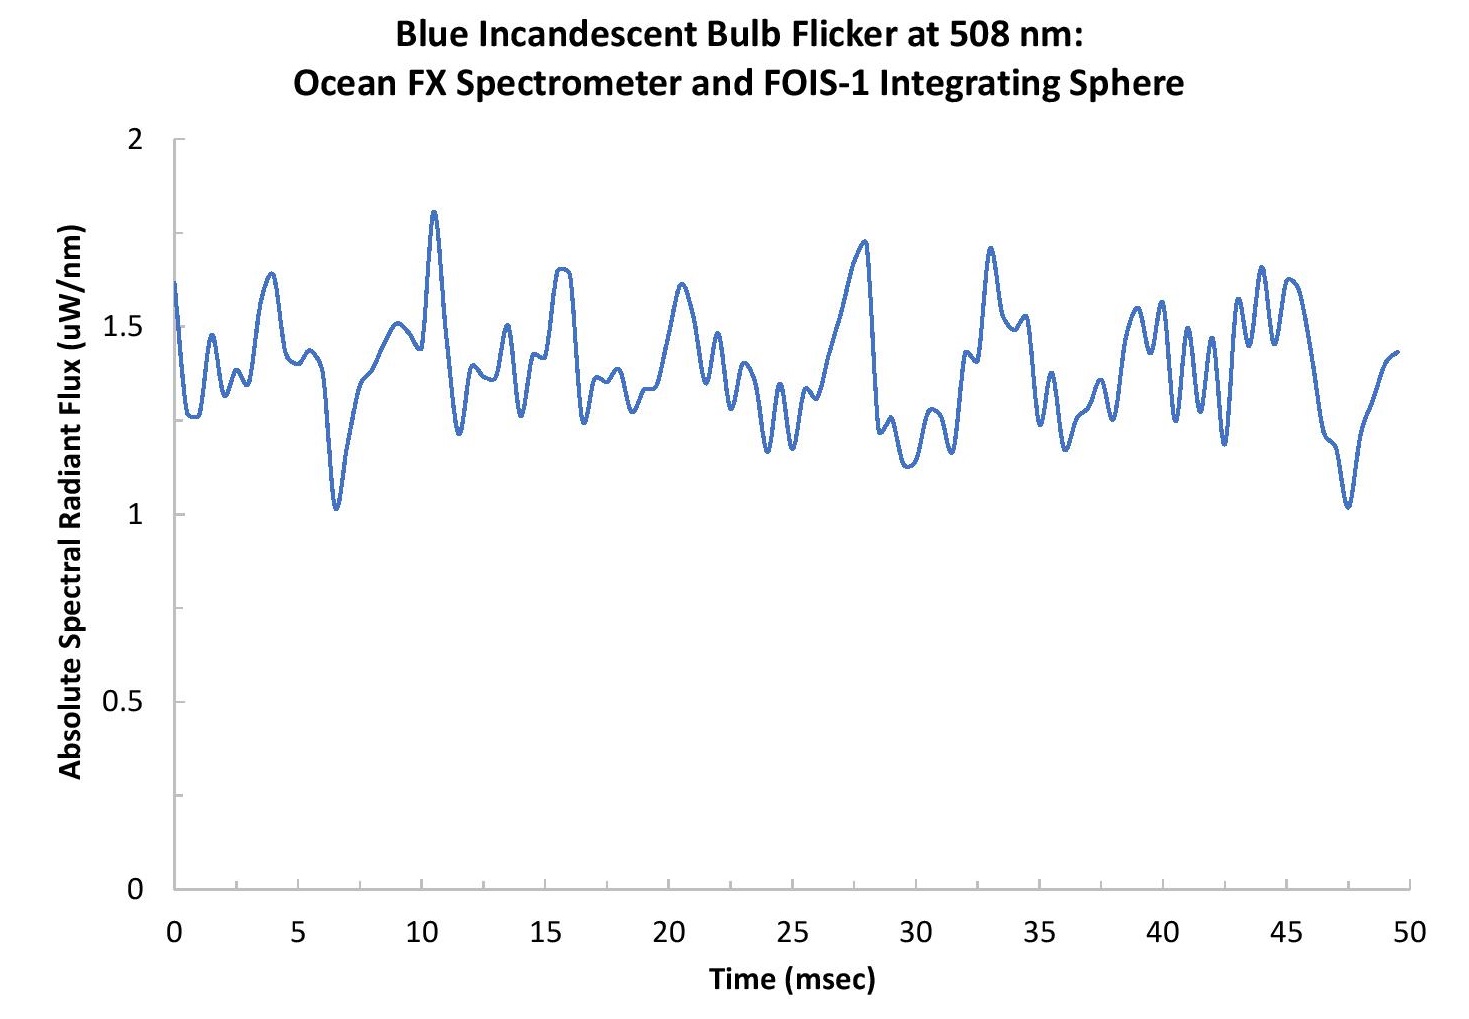
Figure 4. The blue incandescent bulb showed very little change in intensity over time, indicative of lighting with lower flicker characteristics.
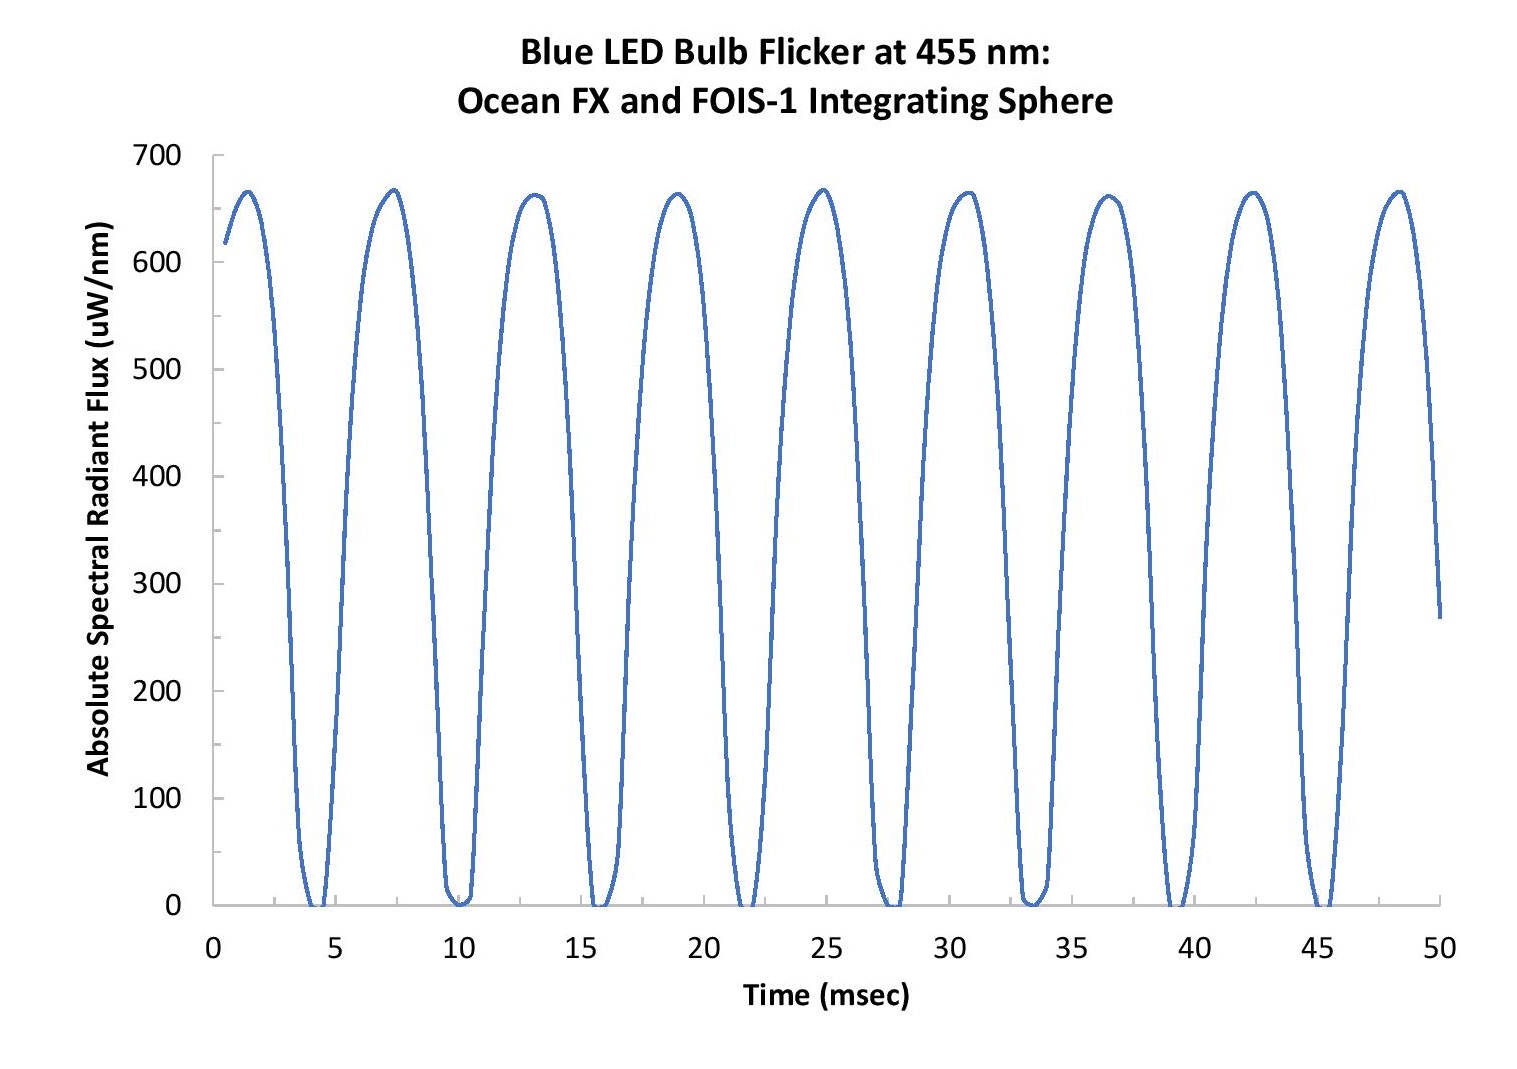
Figure 5. Although its intensity fluctuations were not visible by eye, the blue LED bulb spectral output showed much higher flicker than the blue incandescent bulb.
Also, a consistent oscillation in intensity is observed for the LED while the incandescent bulb shows a more random fluctuation. These differences are related to the nature of the bulbs themselves and not to some difference in setup. The filament used in the incandescent bulbs is not as sensitive to changes in current as the LED. Both measurements were made with the same setup and acquisition parameters (including integration time of 500 ms) while connected to the same AC power. While the measurements in our experiment provide a qualitative assessment of flicker, similar types of high speed measurements also can be used to provide a more quantitative assessment of light source flicker.
The beauty of holiday lights comes from the captivating colors in the multicolored light strings. Our eyes see them as green, blue, orange, yellow, etc., but determining the exact color of the light – if you wanted to match it to a color standard, for example -- requires a quantitative spectroscopy measurement.
We offer several spectrometers useful for characterizing a wide range of lighting parameters including color. The quantitative color values for the bulb colors that were consistent between the two light strings are shown in Table I. These values map to a location on the CIE chromaticity diagram, which allows colors to be defined by a weighted sum of three primary colors. To simplify the complex system of classifying color using the CIE color space, blue colors are represented by low x and y values while green colors are represented by high y values, and reds and oranges by high x values. As you can see by the wide differences in the values for the same color bulbs, quantitative color is a much more rigorous, less subjective measure of color.
Table I. Quantitative Color Measurements for Incandescent and LED Christmas Lights
| Bulb Color | Incandescent | LED | ||
| CIE x | CIE y | CIE x | CIE y | |
| Blue | 0.303 | 0.325 | 0.150 | 0.036 |
| Green | 0.340 | 0.526 | 0.132 | 0.692 |
| Orange | 0.604 | 0.378 | 0.643 | 0.349 |
| Yellow | 0.640 | 0.350 | 0.528 | 0.398 |
Using a compact system comprising just a few components, we measured a range of parameters for the holiday lights including characteristics not perceptible by the human eye. These measurements represent only a fraction of the light characteristics that can be measured with Ocean Insight spectrometers and accessories.
The next time you’re admiring the beauty of Christmas lights, remember that what you see is only a small part of what gives holiday lights their magical appeal. Using the power of spectroscopy, you can unlock the unknown to learn more about what makes holiday lights so festive.
Note: This application noted originally published in 2018 and has been revised slightly.

Featuring real-time, in situ solutions for the field, for use in the lab or on the line, or integrated into other measurement devices.

Receive updates from our team as we share application notes, customer spotlights, educational tools, spectroscopy how-to’s, and more.