Subscribe to Our Blog
Receive updates from our team as we share application notes, customer spotlights, educational tools, spectroscopy how-to’s, and more.
Spectrometer performance criteria can be challenging to interpret, although a common vocabulary can help. In this tech tip, we consider two important yet often misunderstood terms: dynamic range and signal to noise ratio.
Spectroscopy is a complex technique, with many variations and nuances to consider, often framed in terminology that’s not familiar to users or can be interpreted in different ways. Against that backdrop, we offer some practical definitions of dynamic range and signal to noise ratio (SNR), which are criteria typically cited as common measures of spectrometer performance.
In spectroscopy, dynamic range is the ratio between the maximum and minimum signal intensities that a spectrometer can detect. More specifically, dynamic range is the maximum detectable signal (i.e., near saturation) divided by the minimum detectable signal. The minimum detectable signal is defined as the signal with an average equal to the baseline noise.
For our spectrometers, Ocean Insight reports dynamic range in terms of a single acquisition, which is defined as the shortest integration time giving the highest possible dynamic range. The dynamic range specification of the system as a whole is defined as the product of the ratio of maximum to minimum signal at the longest integration time and the ratio of the maximum to minimum integration time.
In practical terms, users can take advantage of the full dynamic range of our spectrometer by setting the integration time for their reference measurements so that the spectrum peaks at 80% to 90% of the full scale of counts.
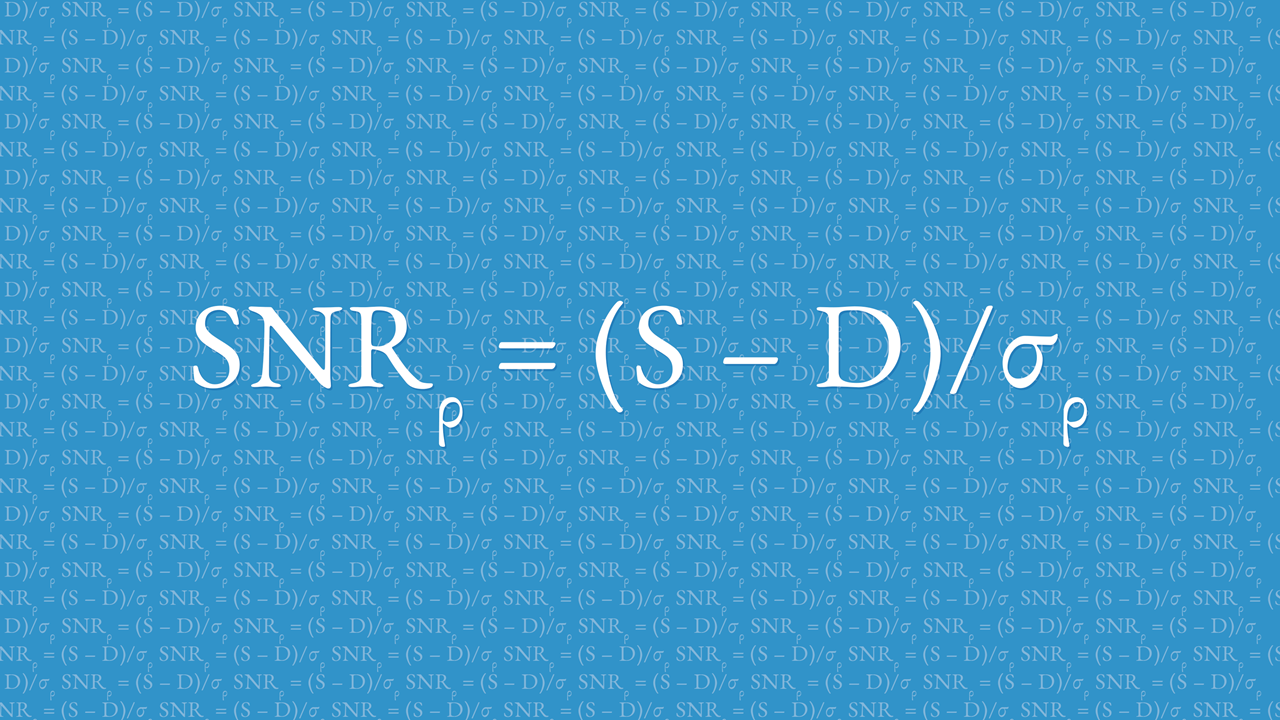
Signal to noise ratio (SNR) is defined as the signal intensity divided by the noise intensity at a certain signal level, which means it can vary from measurement to measurement. Since system noise typically increases as a function of signal due to photon noise, the SNR function is a plot of individual SNR values versus the signal at which they were obtained. The value of a spectrometer’s SNR reported by Ocean Insight is the maximum possible SNR value (obtained at detector saturation). The SNR response curve for each pixel is assumed to be the same.
The SNR measurement is performed as follows: A broadband light source is chosen so that the spectral peak nearly saturates at the lowest integration time or at an integration time well below the thermal noise limit (the spectrum also should have an area of low or nearly zero counts). To calculate SNR, take 100 scans without light and calculate the mean baseline count value at each pixel, then take 100 scans with light and calculate the mean and standard deviation of each pixel output count. The SNR is then given by the following equation:
SNRρ = (S – D)/σρ
where,
SNR = signal to noise ratio
S = mean intensity of the samples (with light)
D = mean of dark (no light)
σ = standard deviation of samples (with light)
ρ = pixel number
To get the complete SNR versus signal graph, plot the calculated SNRρ values (the noise) versus Sρ – Dρ (the signal). This will cover a wide range of peak counts (from dark to nearly saturated). Since all of the pixels have the same response curve, the data for the SNR versus signal graph can come from all of the different pixels. Since photon noise is the largest noise contribution at large signal values, the ideal graph should have a shape that approximates y = √x.
SNR can be improved by using different types of signal averaging. For time-based averaging, the SNR will increase by the square root of the number of spectral scans used. SNR of 300:1, for example, will become 3000:1 if 100 scans are averaged. For spatially based averaging (boxcar), the SNR will increase by the square root of the number of pixels averaged.
While these methods are useful for obtaining precise data, they can make it confusing to compare different spectrometers. For example, Ocean Insight reports its SNR values without applying signal averaging. Many of our competitors take advantage of signal averaging to artificially inflate SNR values on inferior spectrometers.
Understanding terms like dynamic range and SNR is just a small part of becoming familiar with all the parameters of spectrometer performance, and with appreciating how spectrometer specifications are often just a starting place when evaluating anticipated system performance.
Here’s an overview of Ocean Insight spectrometers by detector type, dynamic range and SNR. While these criteria can offer some insight into the suitability of a particular spectrometer model for an application, there are many other factors that go into spectrometer selection. Our Application Engineers can provide guidance.
Contact an Application Engineer
| Spectrometer | Type | Detector | Dynamic Range | SNR | Example Applications |
| Flame | General Purpose | Linear CCD array (two options) | 1300:1 |
250:1 (S-model) 300:1 (T-model) |
Basic lab measurements |
| Ocean HDX | High Sensitivity | Back-thinned CCD image sensor | 12000:1 | 400:1 |
Plasma analysis Low light applications Absorbance of high OD liquids |
| QE Pro | High Sensitivity | Back-thinned, TE-cooled CCD array | 85000:1 | 1000:1 |
Low light applications including: Fluorescence DNA analysis Raman |
| Maya2000 Pro | High Sensitivity | Back-thinned CCD image sensor | 15000:1 | 450:1 |
Low light level fluorescence and Raman Analysis of solutions, solids and gases |
| STS | Microspectrometers | CMOS | 4600:1 | 1500:1 |
Low-concentration absorbance High-intensity laser analysis Integration into other devices |
| NIRQuest+ | NIR (900-2500 nm) | InGaAs linear array (multiple options) | 15000:1 (900-1700 nm version) | 13000:1 (900-1700 nm version) |
Moisture detection Hydrocarbon analysis Polymer identification |
| Flame-NIR+ | NIR (900-1700 nm) | Uncooled InGaAs linear array | 6000:1 | 6000:1 |
Food composition analysis Plastics recycling Pharma QC |
| Ocean FX | High Speed | CMOS | 5000:1 | 290:1 |
Flicker in lighting High-speed process applications |
| HR | High Resolution | Linear CCD array | 2000:1 | 250:1 |
Laser characterization Emission line analysis |
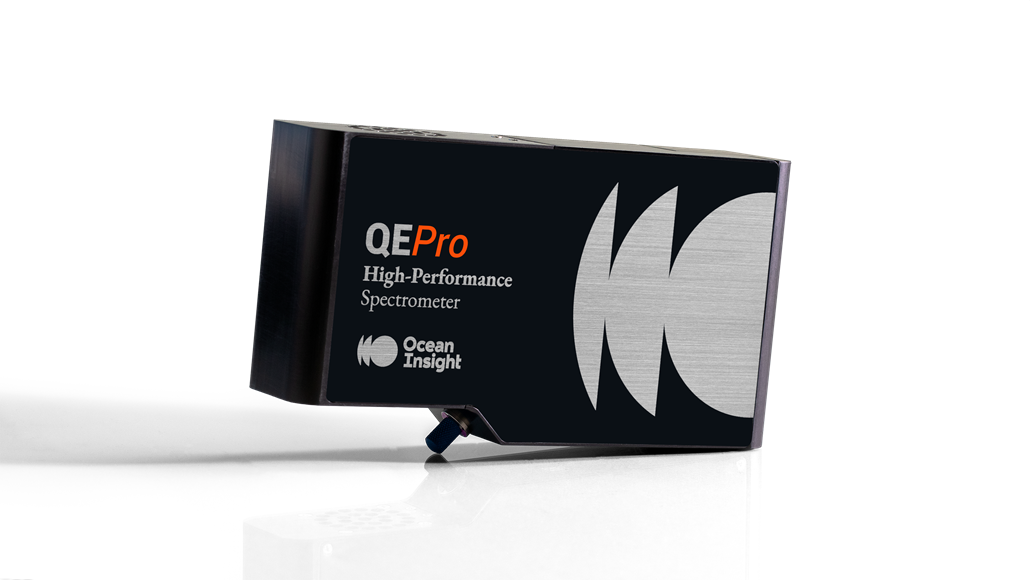
The QE Pro series spectrometers offer high sensitivity with low stray light performance. The spectrometers are ideal for a wide range of low light level applications such as fluorescence, DNA sequencing and Raman analysis.
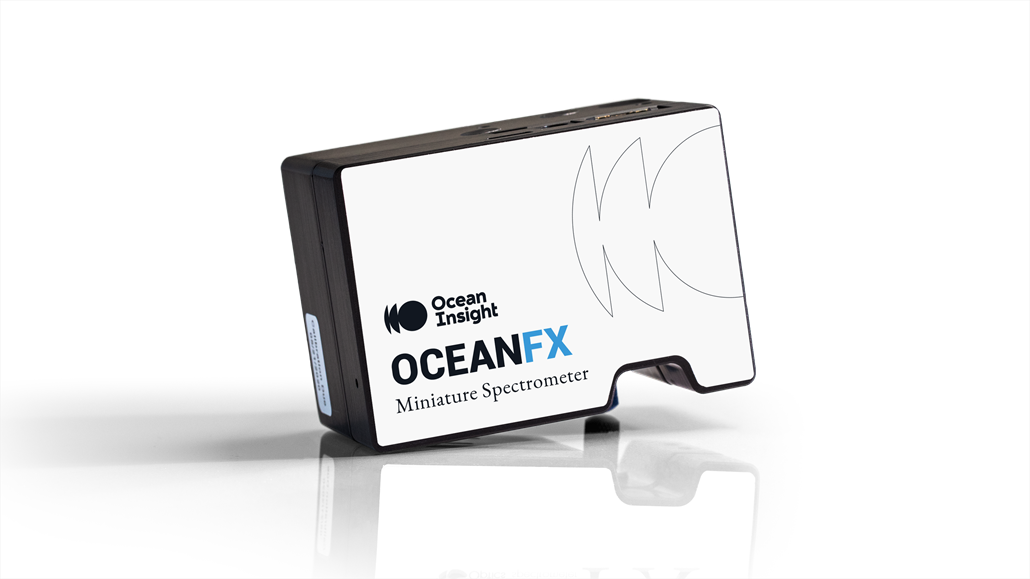
Ocean FX VIS-NIR (350-1000 nm) Spectrometer

Receive updates from our team as we share application notes, customer spotlights, educational tools, spectroscopy how-to’s, and more.