Subscribe to Our Blog
Receive updates from our team as we share application notes, customer spotlights, educational tools, spectroscopy how-to’s, and more.

We describe spectral data acquisition parameters in OceanView operating software, from integration time to scans to average. Use OceanView acquisition and processing features to optimize experiment settings.
Note: Please refresh your browser if you do not see any screenshots or icons in this material.
Q: I’m getting started in OceanView and don’t understand how best to use the data acquisition parameters that are available. What do I need to know?
A: Understanding the key data acquisition parameters available in OceanView will help ensure best results for your spectral measurements. This is important even if you’re using one of OceanView’s wizards, which guide you through the steps for specific measurements (absorbance, color and so on) but still require you to input most data acquisition parameters.
Additional resources offering insight on this FAQ are available at our Glossary and via the links at the bottom of this page.
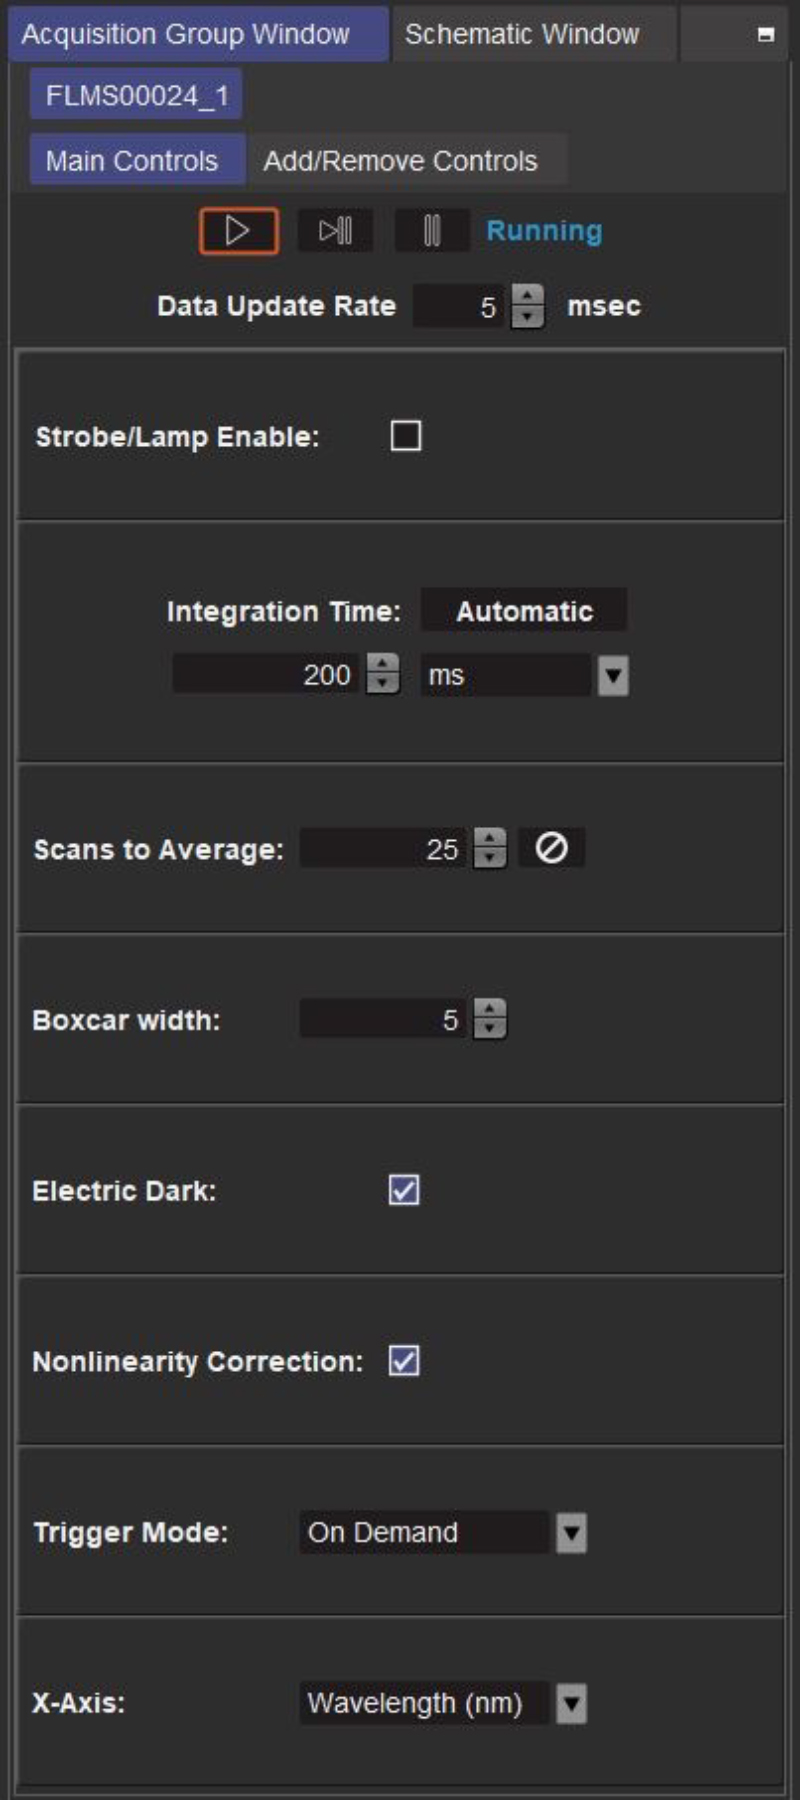
This is the first parameter that you will set. Integration time is the period of time over which the spectrometer collects photons and correlates with the intensity of the signal that is captured. We find that the best measurements are made when the signal intensity is between 80% and 90% of its full range. When setting integration time, be careful not to allow any pixels to become saturated, as these pixels will not provide useful data.
Quick tip: In OceanView 2.0.8 and higher versions, there’s a convenient feature that automatically selects the integration time appropriate for your setup. Activating this feature is as simple as selecting the Automatic option in the Acquisition Group Window of OceanView.
This time-based averaging function specifies the number of discrete spectral acquisitions that the device driver accumulates before OceanView receives a spectrum. The higher the value, the better the signal-to-noise ratio (SNR). The SNR will improve by the square root of the number of scans averaged.
Quick tip: To convey the “true” SNR of its spectrometers, Ocean Insight reports SNR specifications without signal averaging applied.
Boxcar smoothing is a technique that averages a group of adjacent detector elements across spectral data. For example, a boxcar width value of 5 averages each data point with 5 points to its left and 5 points to its right.
The greater the boxcar width value, the smoother the data and the higher the SNR. If the value entered is too high, a loss in spectral resolution will result and peaks will become flattened. The SNR will improve by the square root of the number of pixels averaged.
Quick tip: There’s a more detailed explanation of boxcar smoothing and its trade-offs in the Glossary section of our Technical Hub.
Many spectrometers have a small number of dark pixels. A dark pixel is an electrically active CCD detector pixel that has been physically coated to prevent any light from entering. Due to leakage, a small amount of electrons escape from the detector well even if there is absolutely no light.
To eliminate any error due to leakage, electric dark correction computes an average value of these dark pixels over 15 consecutive scans, and then subtracts this average value from all pixels in the spectrum. Although the algorithm specifies that 15 consecutive scans be averaged, the correction factor is applied as soon as the first spectrum of data becomes available. Then additional scans are averaged into the correction factor as these spectra become available. A running average of the most recent 15 scans is maintained.
The amount of electron leakage is proportional to the duration of the integration time. So, whenever the integration time is changed, the previous correction factor is discarded and we then begin to compute a new correction factor based entirely on the new integration time.
All Ocean Insight spectrometers are calibrated at the factory to maximize accuracy. One of the calibrations performed is to correct for detector non-linearity. This calibration consists of eight numbers used as the coefficients of a 7th order polynomial, which adjusts for the phenomenon that CCD detectors do not respond to stimuli photons uniformly as more electrons drain from the detector well. In other words, the efficiency of CCD detectors may be 30% when the well is half-full but may be only 20% when the well is completely drained of electrons.
By “efficiency” we mean the probability that an incoming photon will drain an electron from the CCD well; 100% efficiency means every incoming photon will drain one electron, while 50% efficiency means an incoming photon has only a 50% chance of causing an electron to drain. Non-linearity calibration is made by averaging together all pixels of the CCD array. Thus, we are assuming that all pixels respond about the same.
Quick tip: Detector linearity is different than absorbance linearity, which is associated with Beer’s Law.
Options available
OceanView 2.0 is a smooth and powerful new version of our flagship spectroscopy application. The software runs on Windows, Mac OS and Linux, and controls Ocean Insight spectrometers.
Prices From $305.00

Options available
OceanDirect is a powerful device driver platform with API for control of Ocean Insight spectrometers.
Prices From $625.00
Experts Yvette Mattley and Derek Guenther guide listeners on a tour of OceanView 2.0 software.
The second part of OceanView 2.0 Webinar Series covers The Wizard and the Power of the Schematic.
The last video answers some of the pressing questions from our customers. Thank You!

Visit our FAQs section for simple, straightforward answers to your most common questions about Ocean Optics products, measurements and software.

Receive updates from our team as we share application notes, customer spotlights, educational tools, spectroscopy how-to’s, and more.