Subscribe to Our Blog
Receive updates from our team as we share application notes, customer spotlights, educational tools, spectroscopy how-to’s, and more.
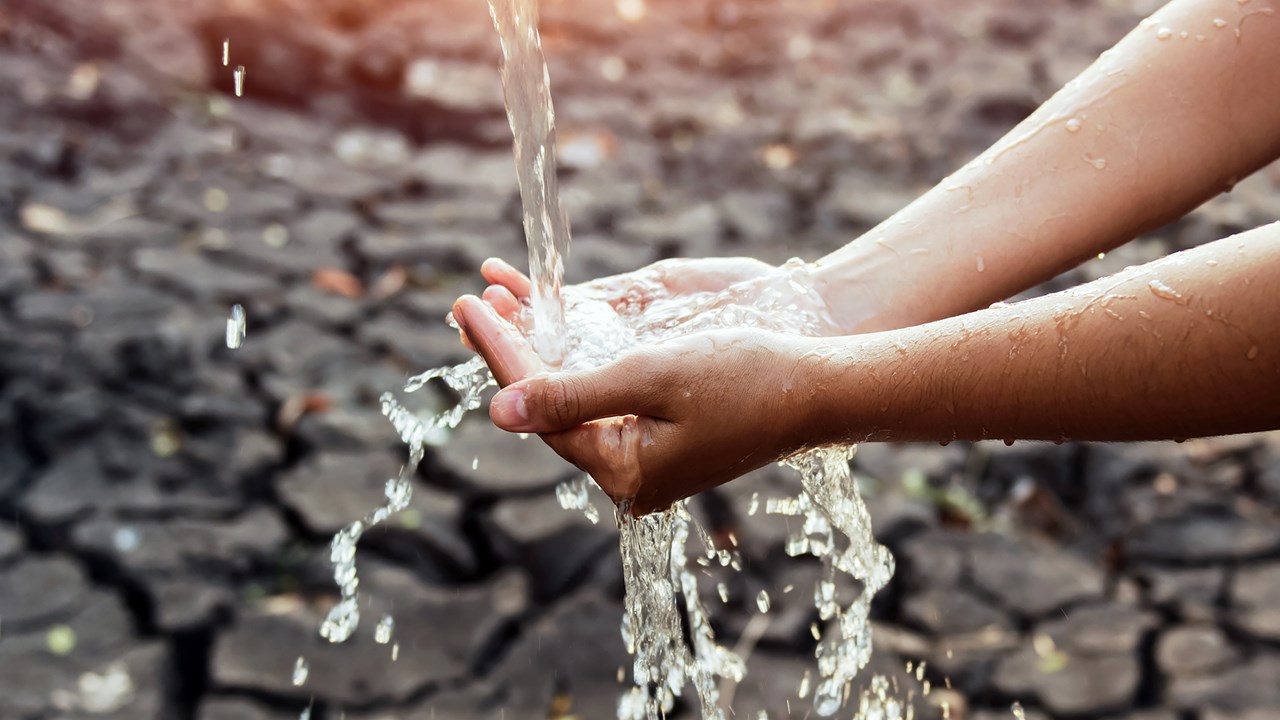
In this post and its accompanying video, we measure the spectra of various drinking and surface water samples and share information on an organization working to ensure clean water for all.
IMPORTANT: PLEASE REFRESH YOUR BROWSER IF YOU DO NOT SEE ANY IMAGES/SCREENSHOTS/SPECTRA ON THE PAGE.
The confluence of two recent events – a trip to the local grocery store and our company’s relationship with the charitable organization WaterAid – inspired our investigation of several types of bottled and surface waters. Here’s what our initial analysis revealed.
In the U.S. and other developed countries, drinking water – whether it comes from local municipalities via the tap or from manufacturers that bottle it at the source – is carefully regulated, widely available and often taken for granted. Using an Ocean HDX spectrometer, we were curious to measure some samples to determine any spectral differences.
We began with several bottled water samples from a local grocery that’s part of a bigger chain in the southeastern U.S. First up: spring water. According to the U.S. Food and Drug Administration, spring water is “derived from an underground formation from which water flows naturally to the surface of the earth.” These spring water samples appeared to vary in composition (sometimes dramatically) depending on what facility they came from (Figure 1).
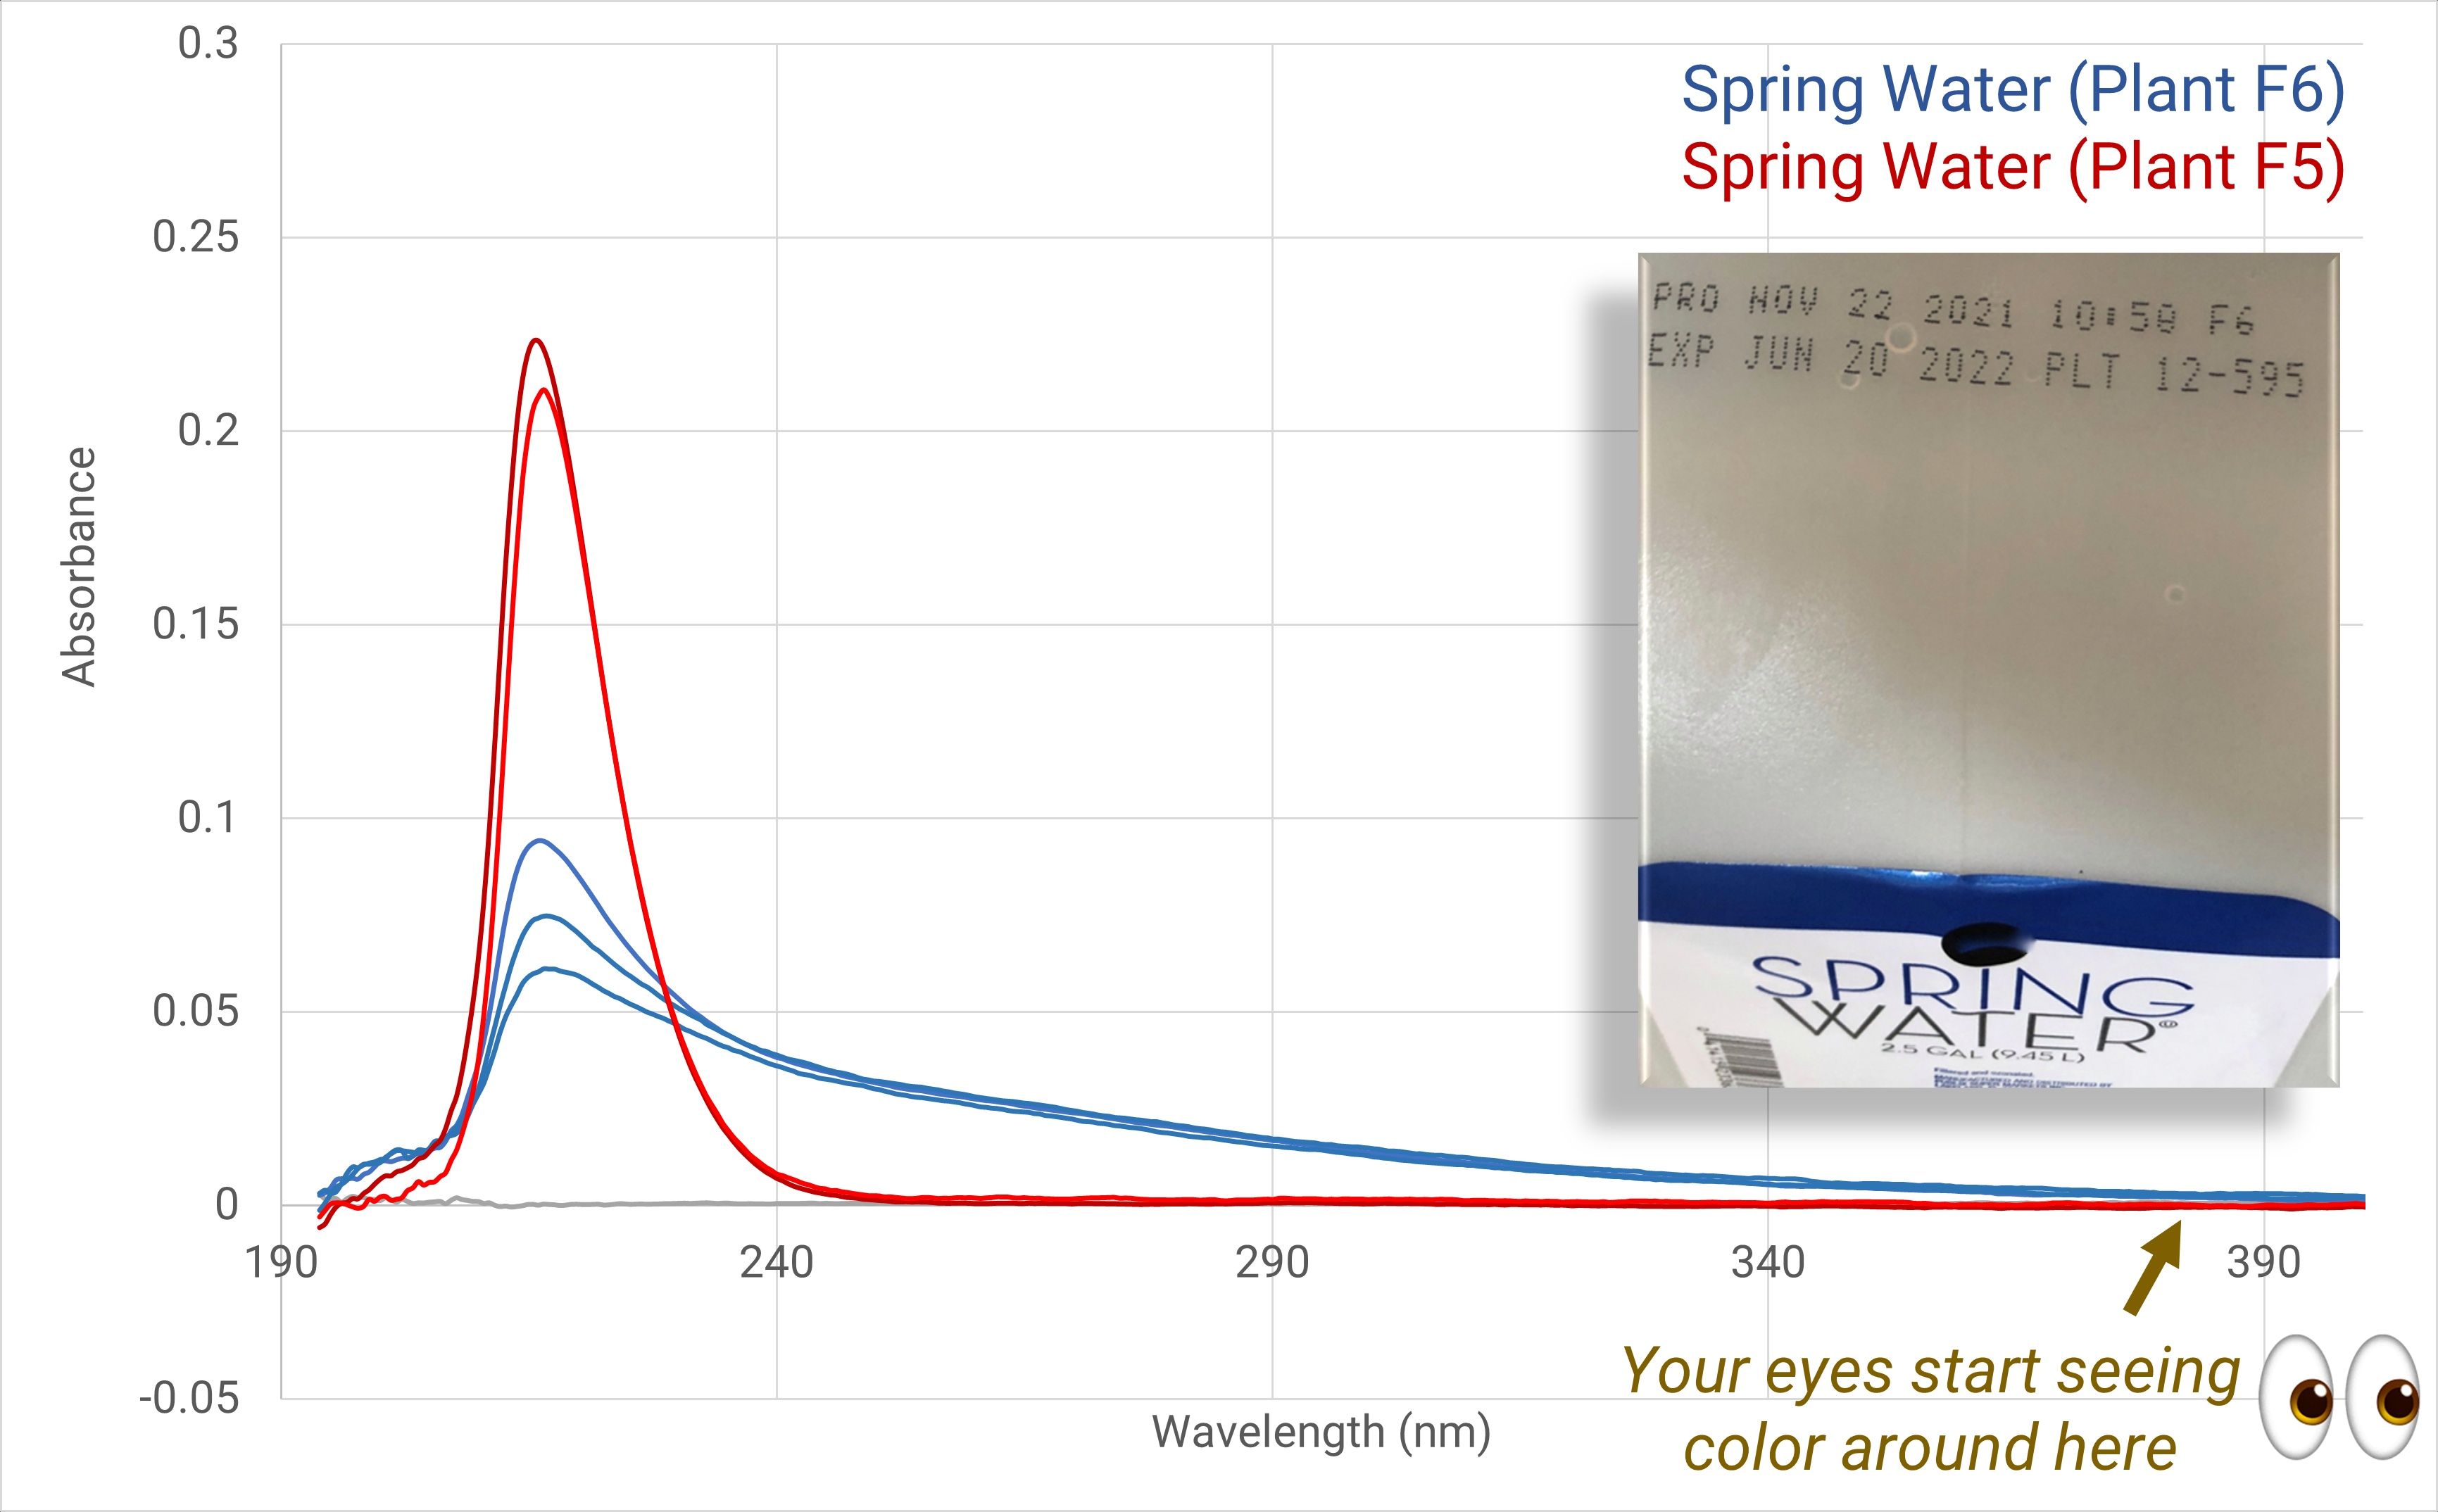
Figure 1. Grocery-store brand spring water
We next measured drinking water, a designation for water used in drink or food preparation. Our drinking water sample from the same grocery store revealed more UV spectral activity (Figure 2) than in the spring water, suggesting the possible presence of more dissolved solids and/or organics.
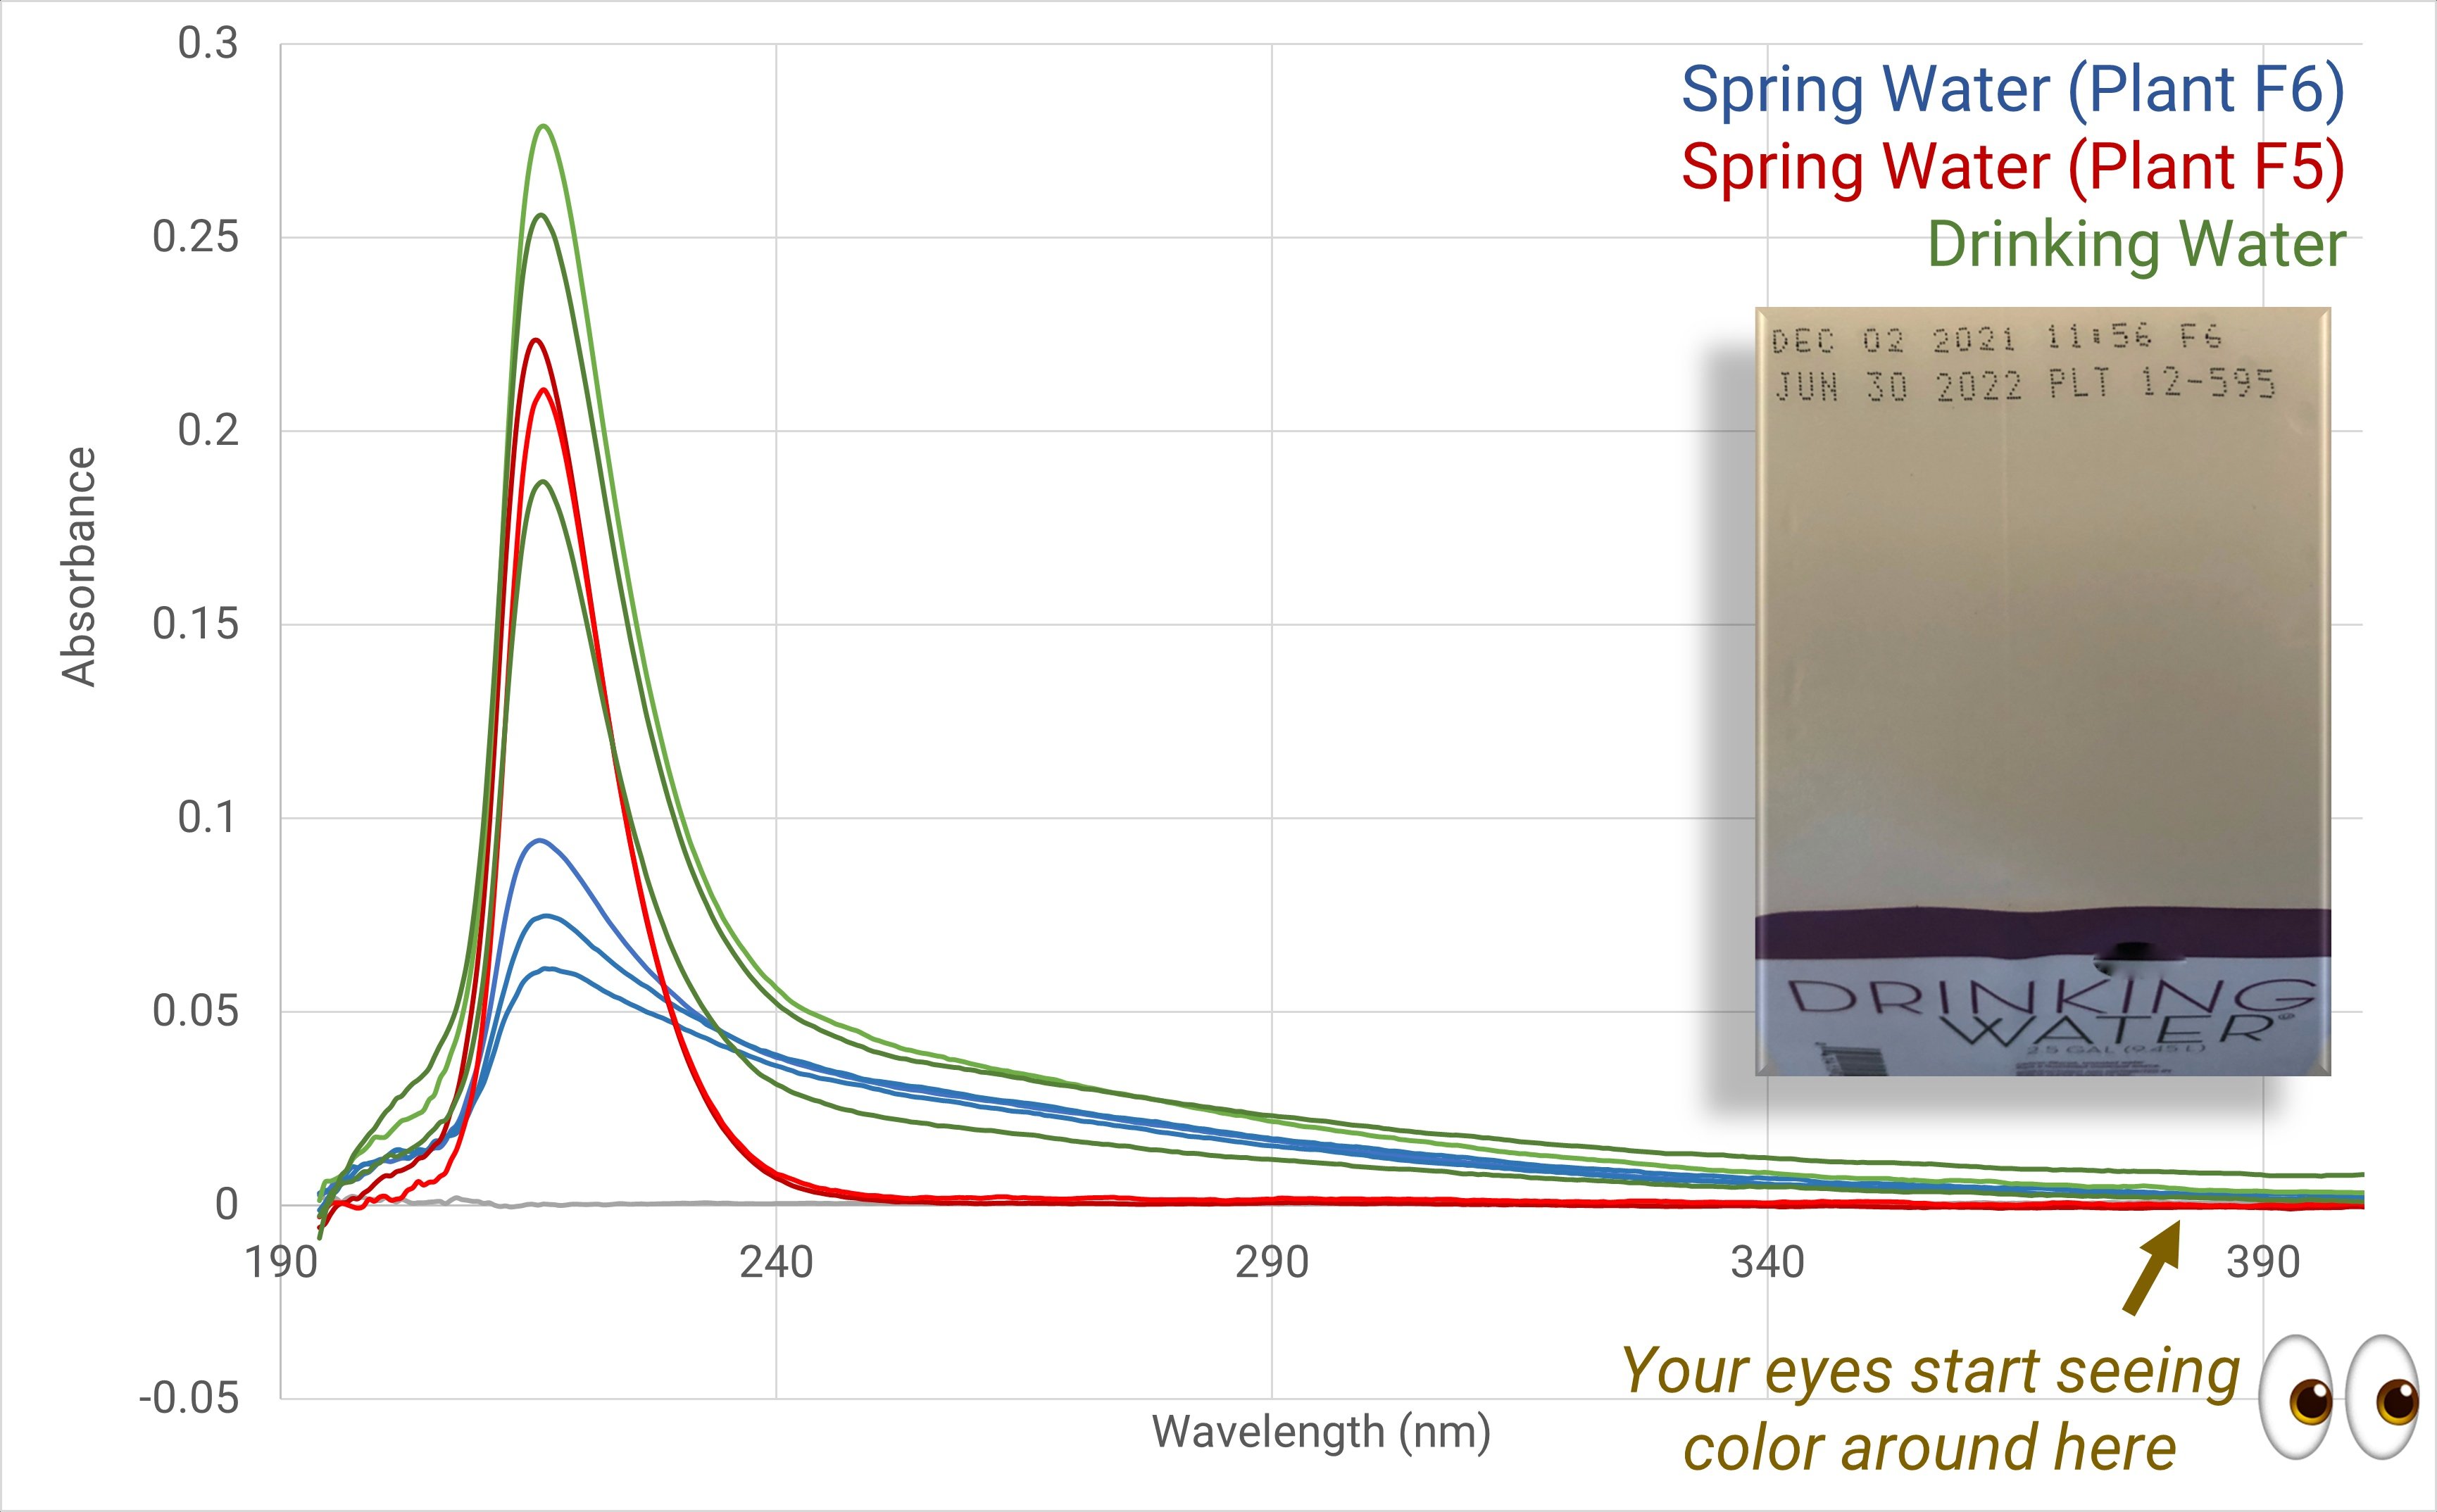
Figure 2. Grocery-store brand drinking water
For comparison, we also tested a local tap water sample. It had a lower UV peak than the bottled water but showed more activity from 240-290 nm (Figure 3). This likely results from the addition of water treatments such as fluoride and from trace contaminants in the pipelines that transport water from treatment facilities.
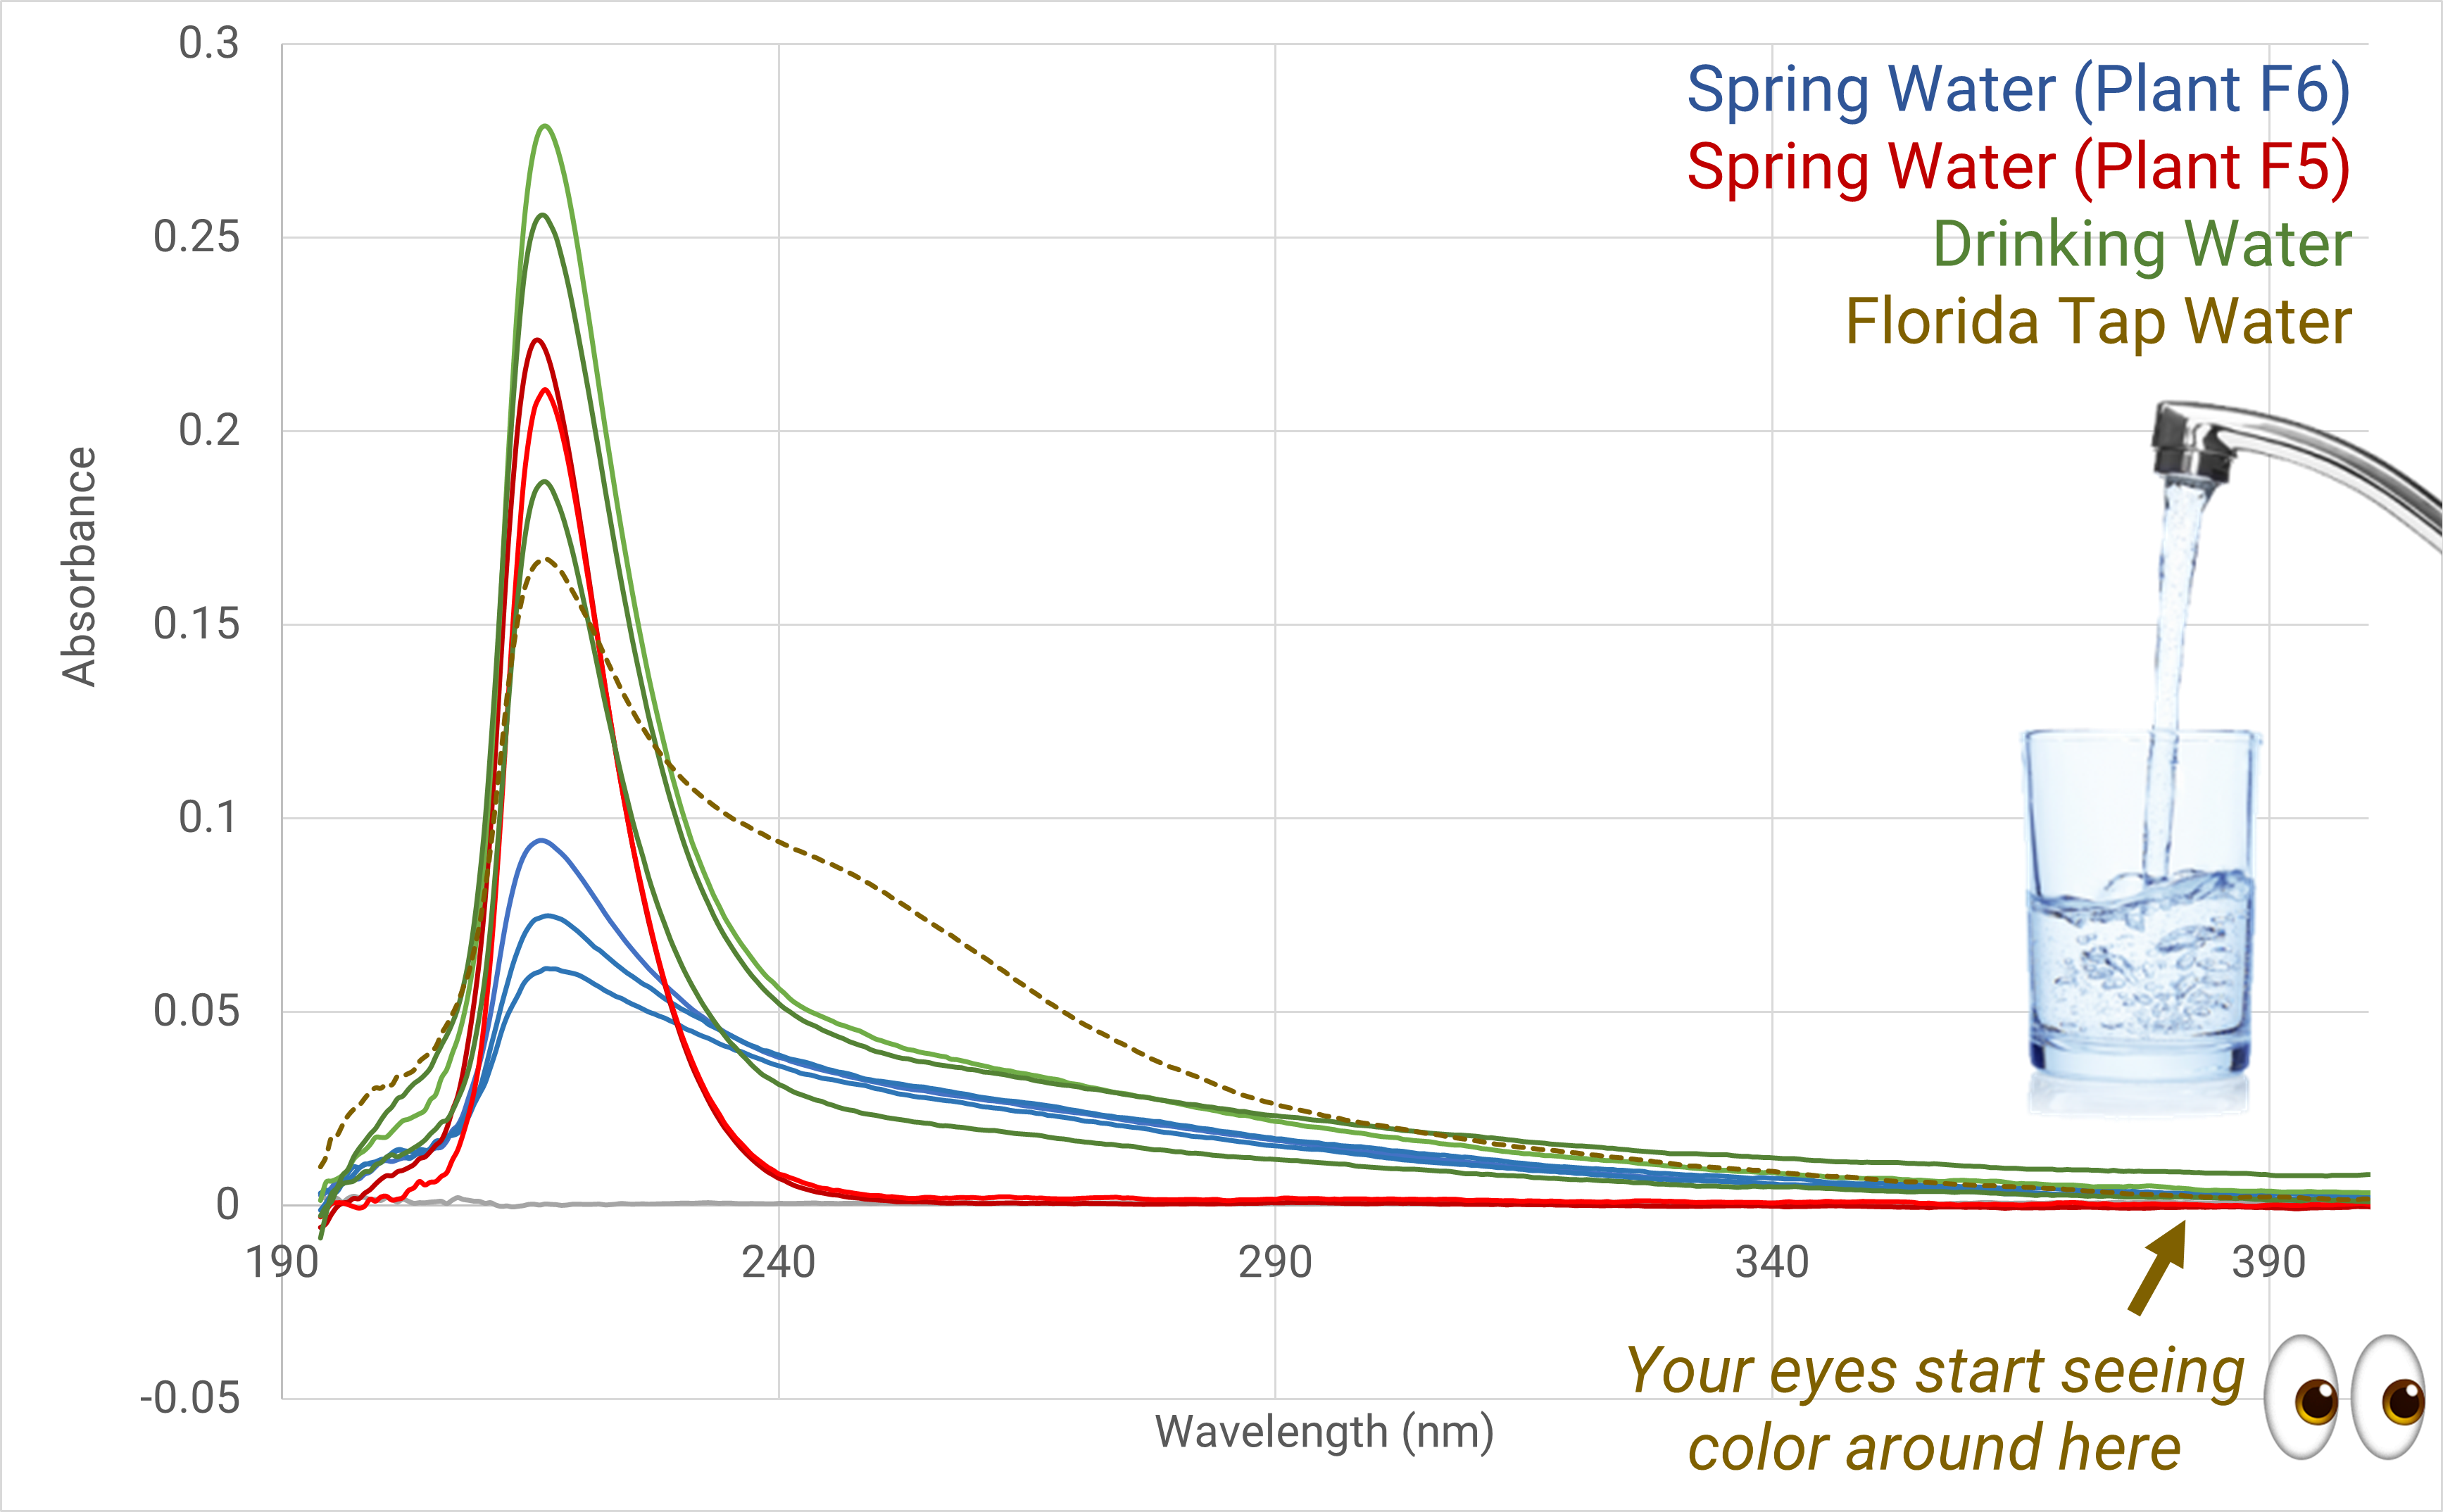
Figure 3. Municipal (tap) water, St. Petersburg, Fla.
To round out our survey of regulated water sources, we measured a sample of an expensive bottled water brand. Although this water is about 6x the cost for a case (24) of 16.9 oz. (500 ml) bottles, the expensive-brand samples we tested had very similar spectral characteristics as the store-brand spring water samples (Figure 4). Consumers don’t seem to mind the extra expense – according to several sources, the top bottled water brands have annual sales in the billions.
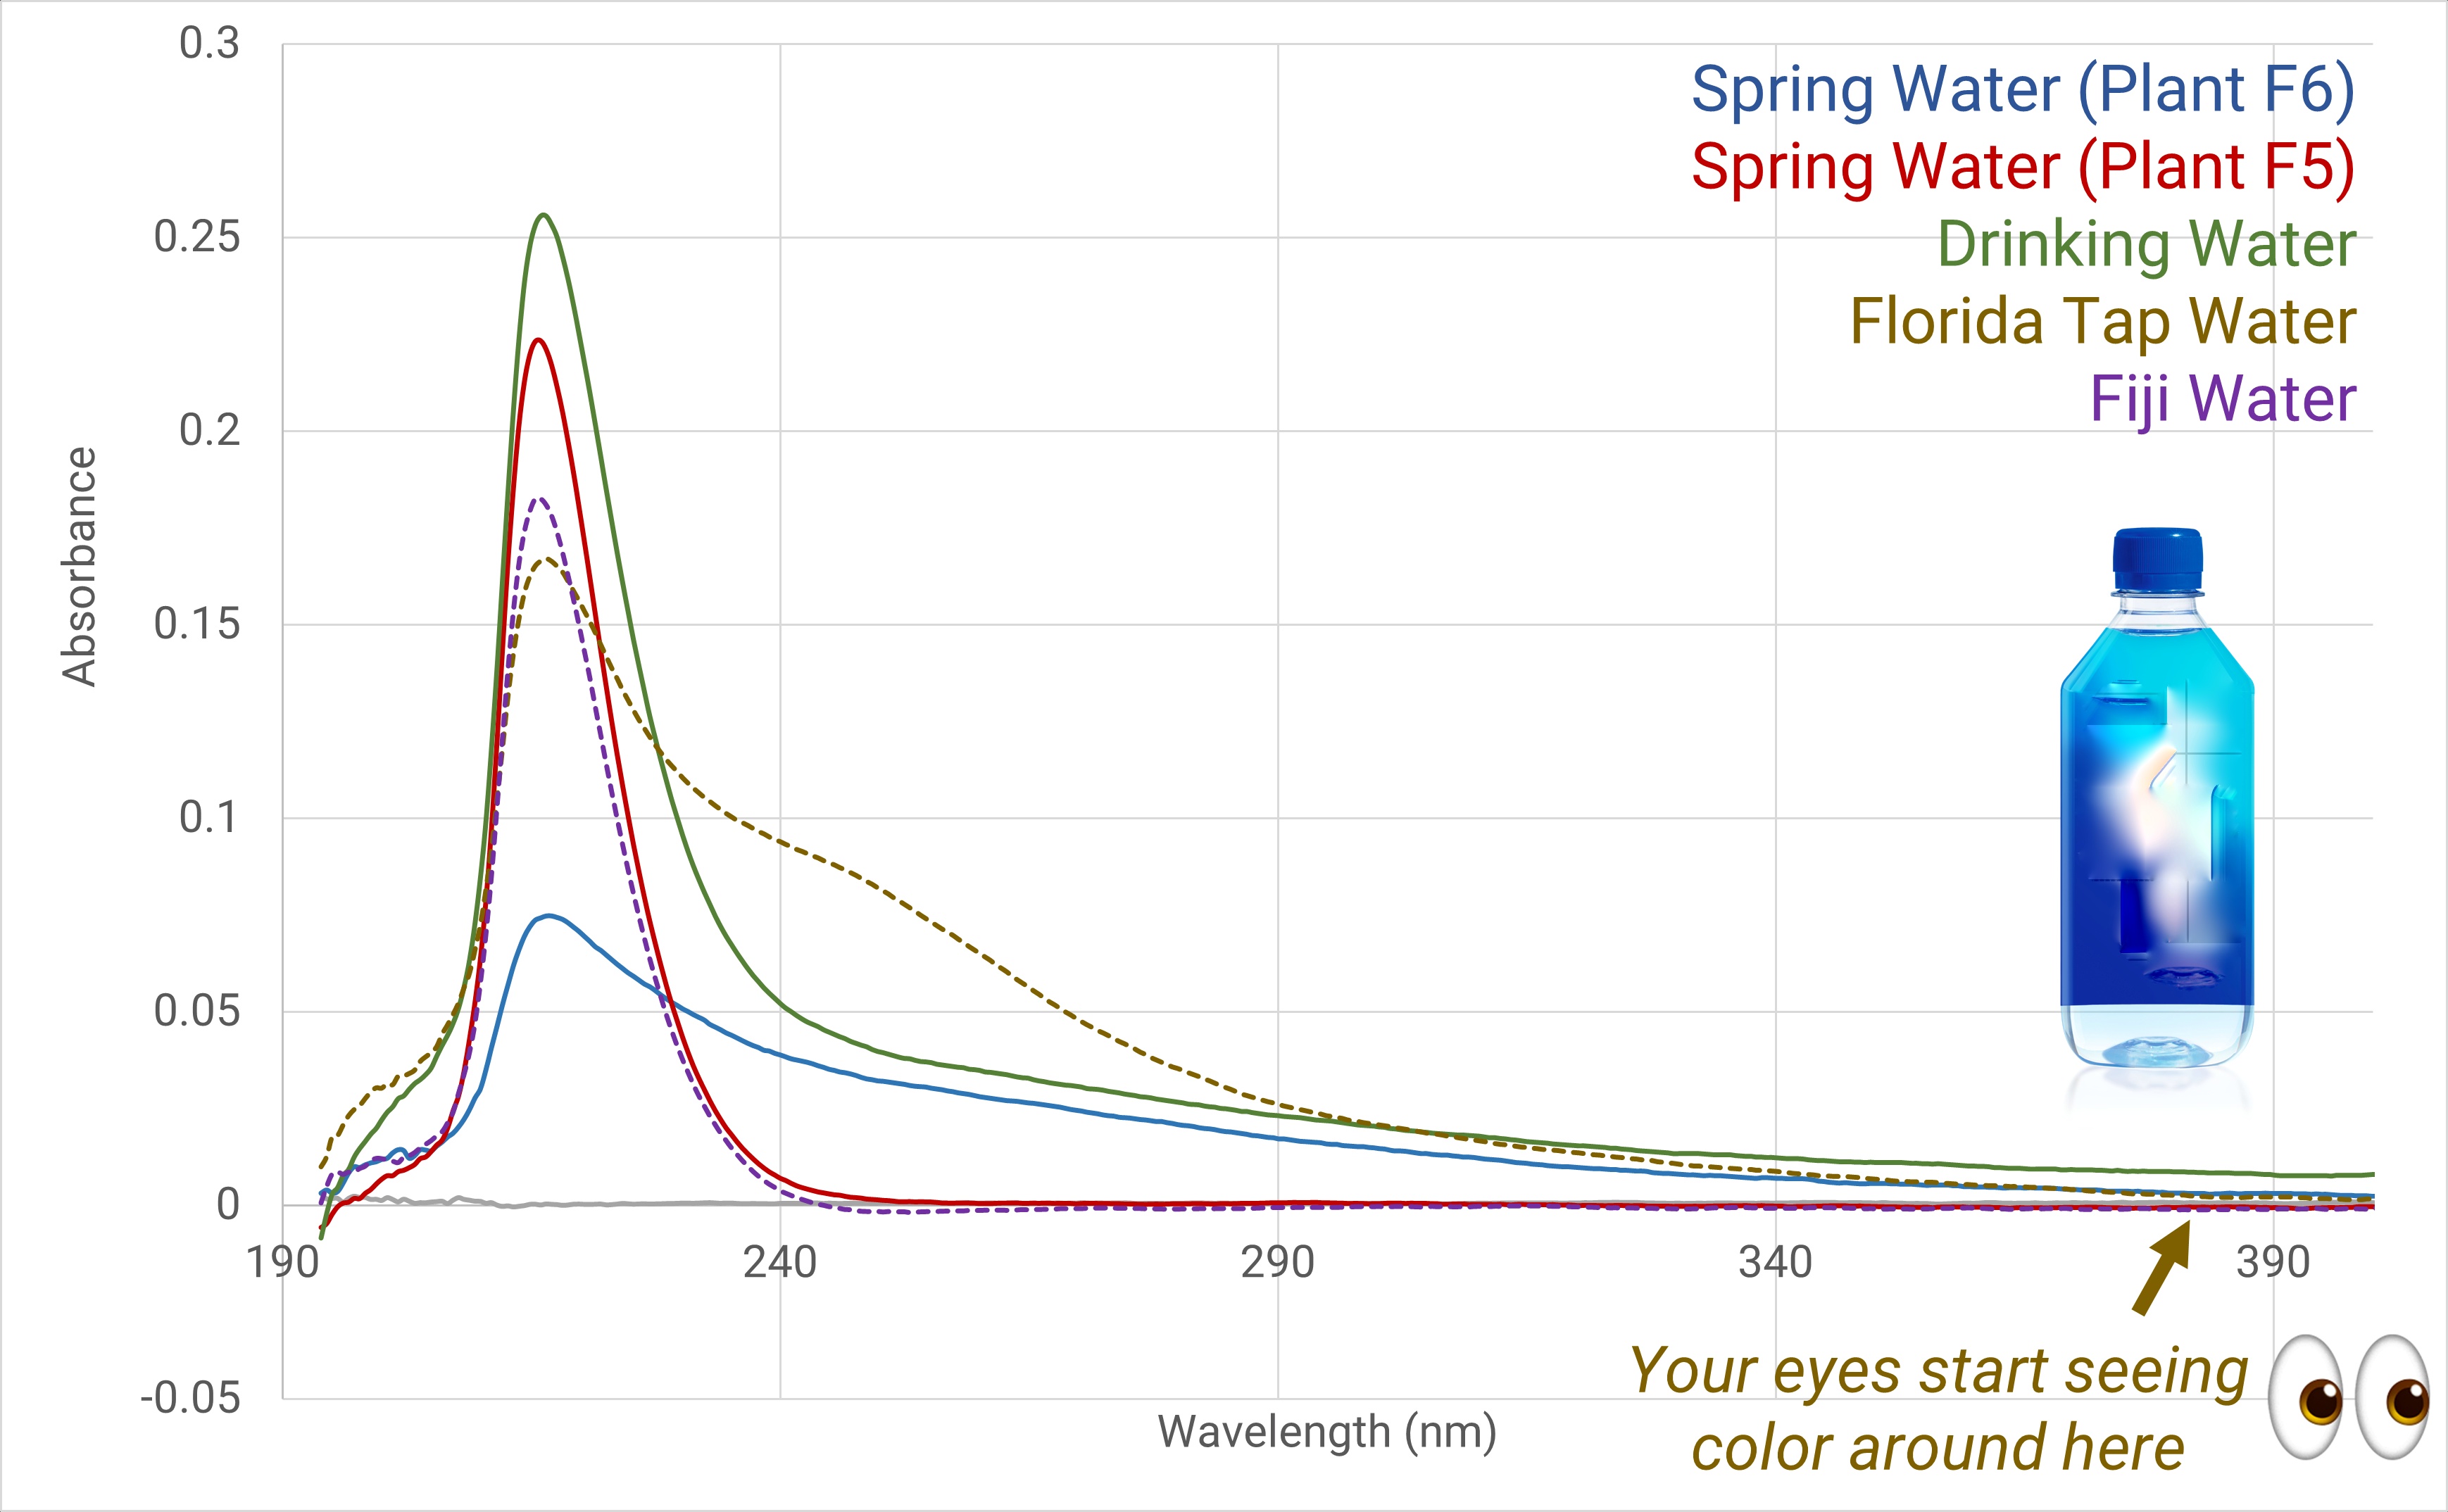
Figure 4. High-end bottled water
To better appreciate the water quality (or lack thereof) that many people in less developed countries experience, we also tested surface water from two separate areas of the U.S., in two very different regions.
In the Pacific Northwest, we tested both snowmelt (Figure 5) and ground snow (Figure 6) collected on or near Mt. Spokane, Washington. For context, Mt. Spokane has an elevation of nearly 6,000 ft., averages about 163 inches (413 cm) of snowfall annually, and is about 35 miles from Spokane, a city of approximately 220,000. Interestingly, the Mt. Spokane water samples were very similar spectrally to the grocery store spring water and drinking water samples.
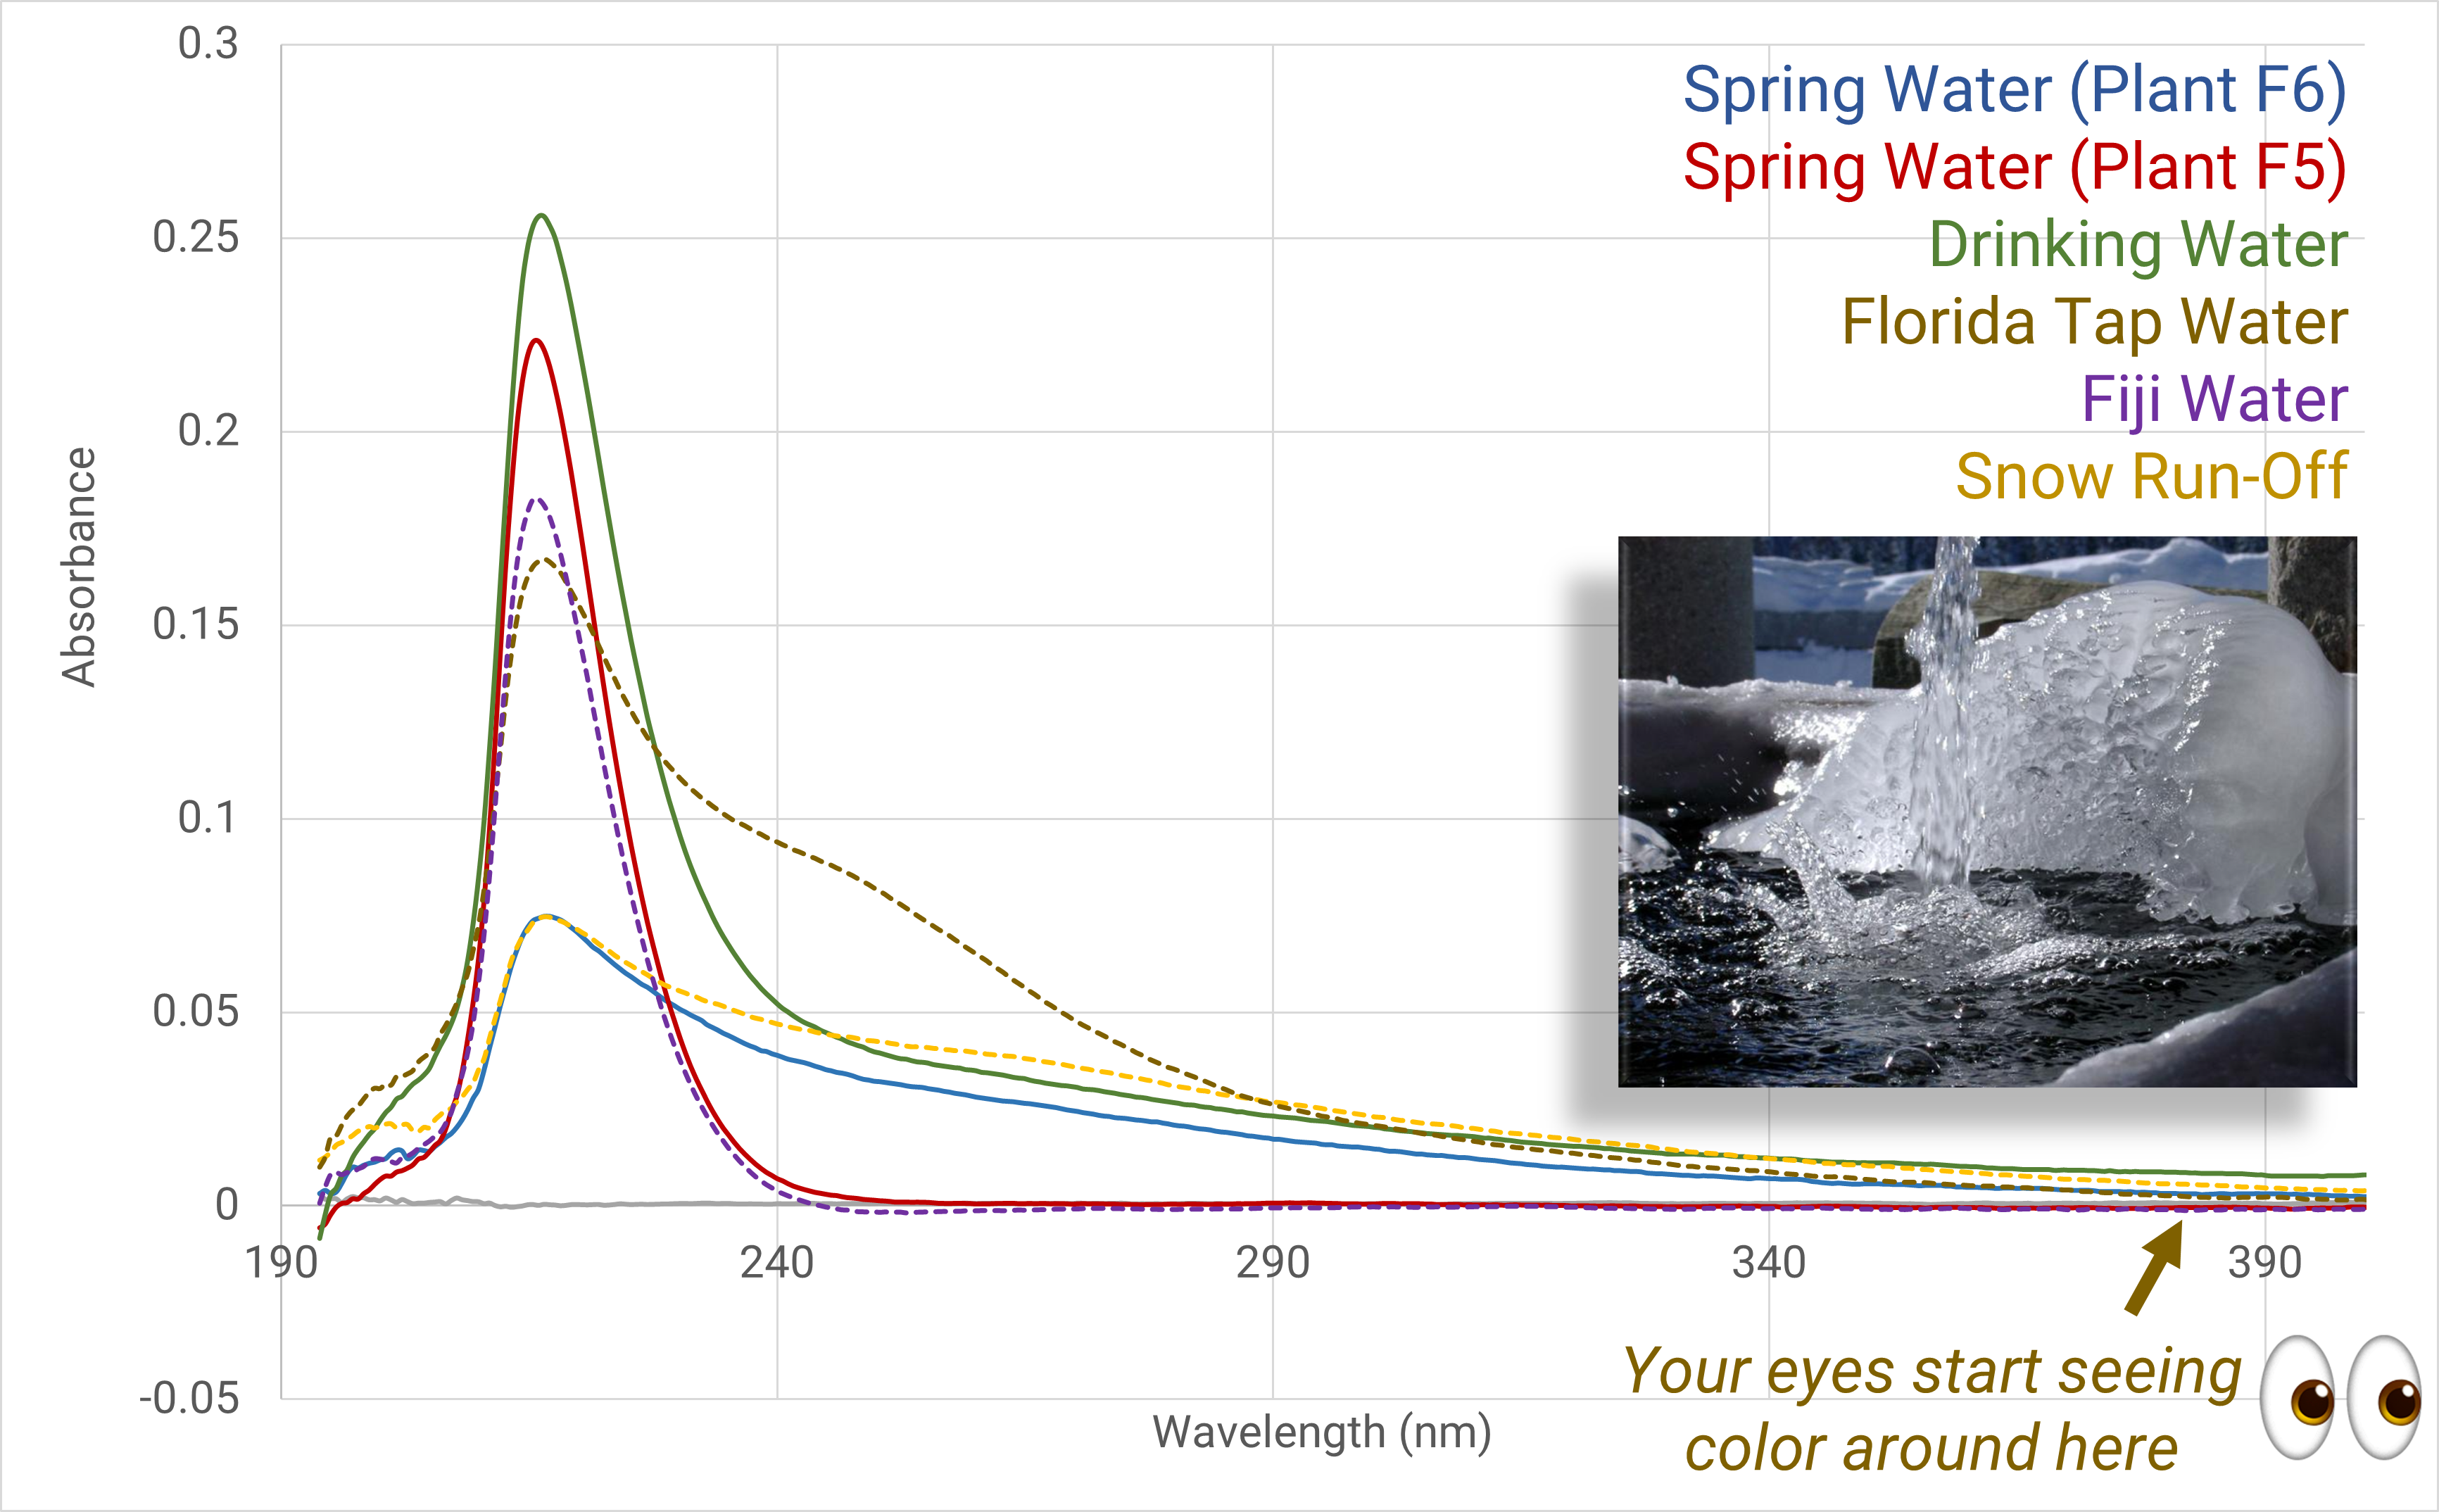
Figure 5. Snowmelt, Mt. Spokane, Wash.
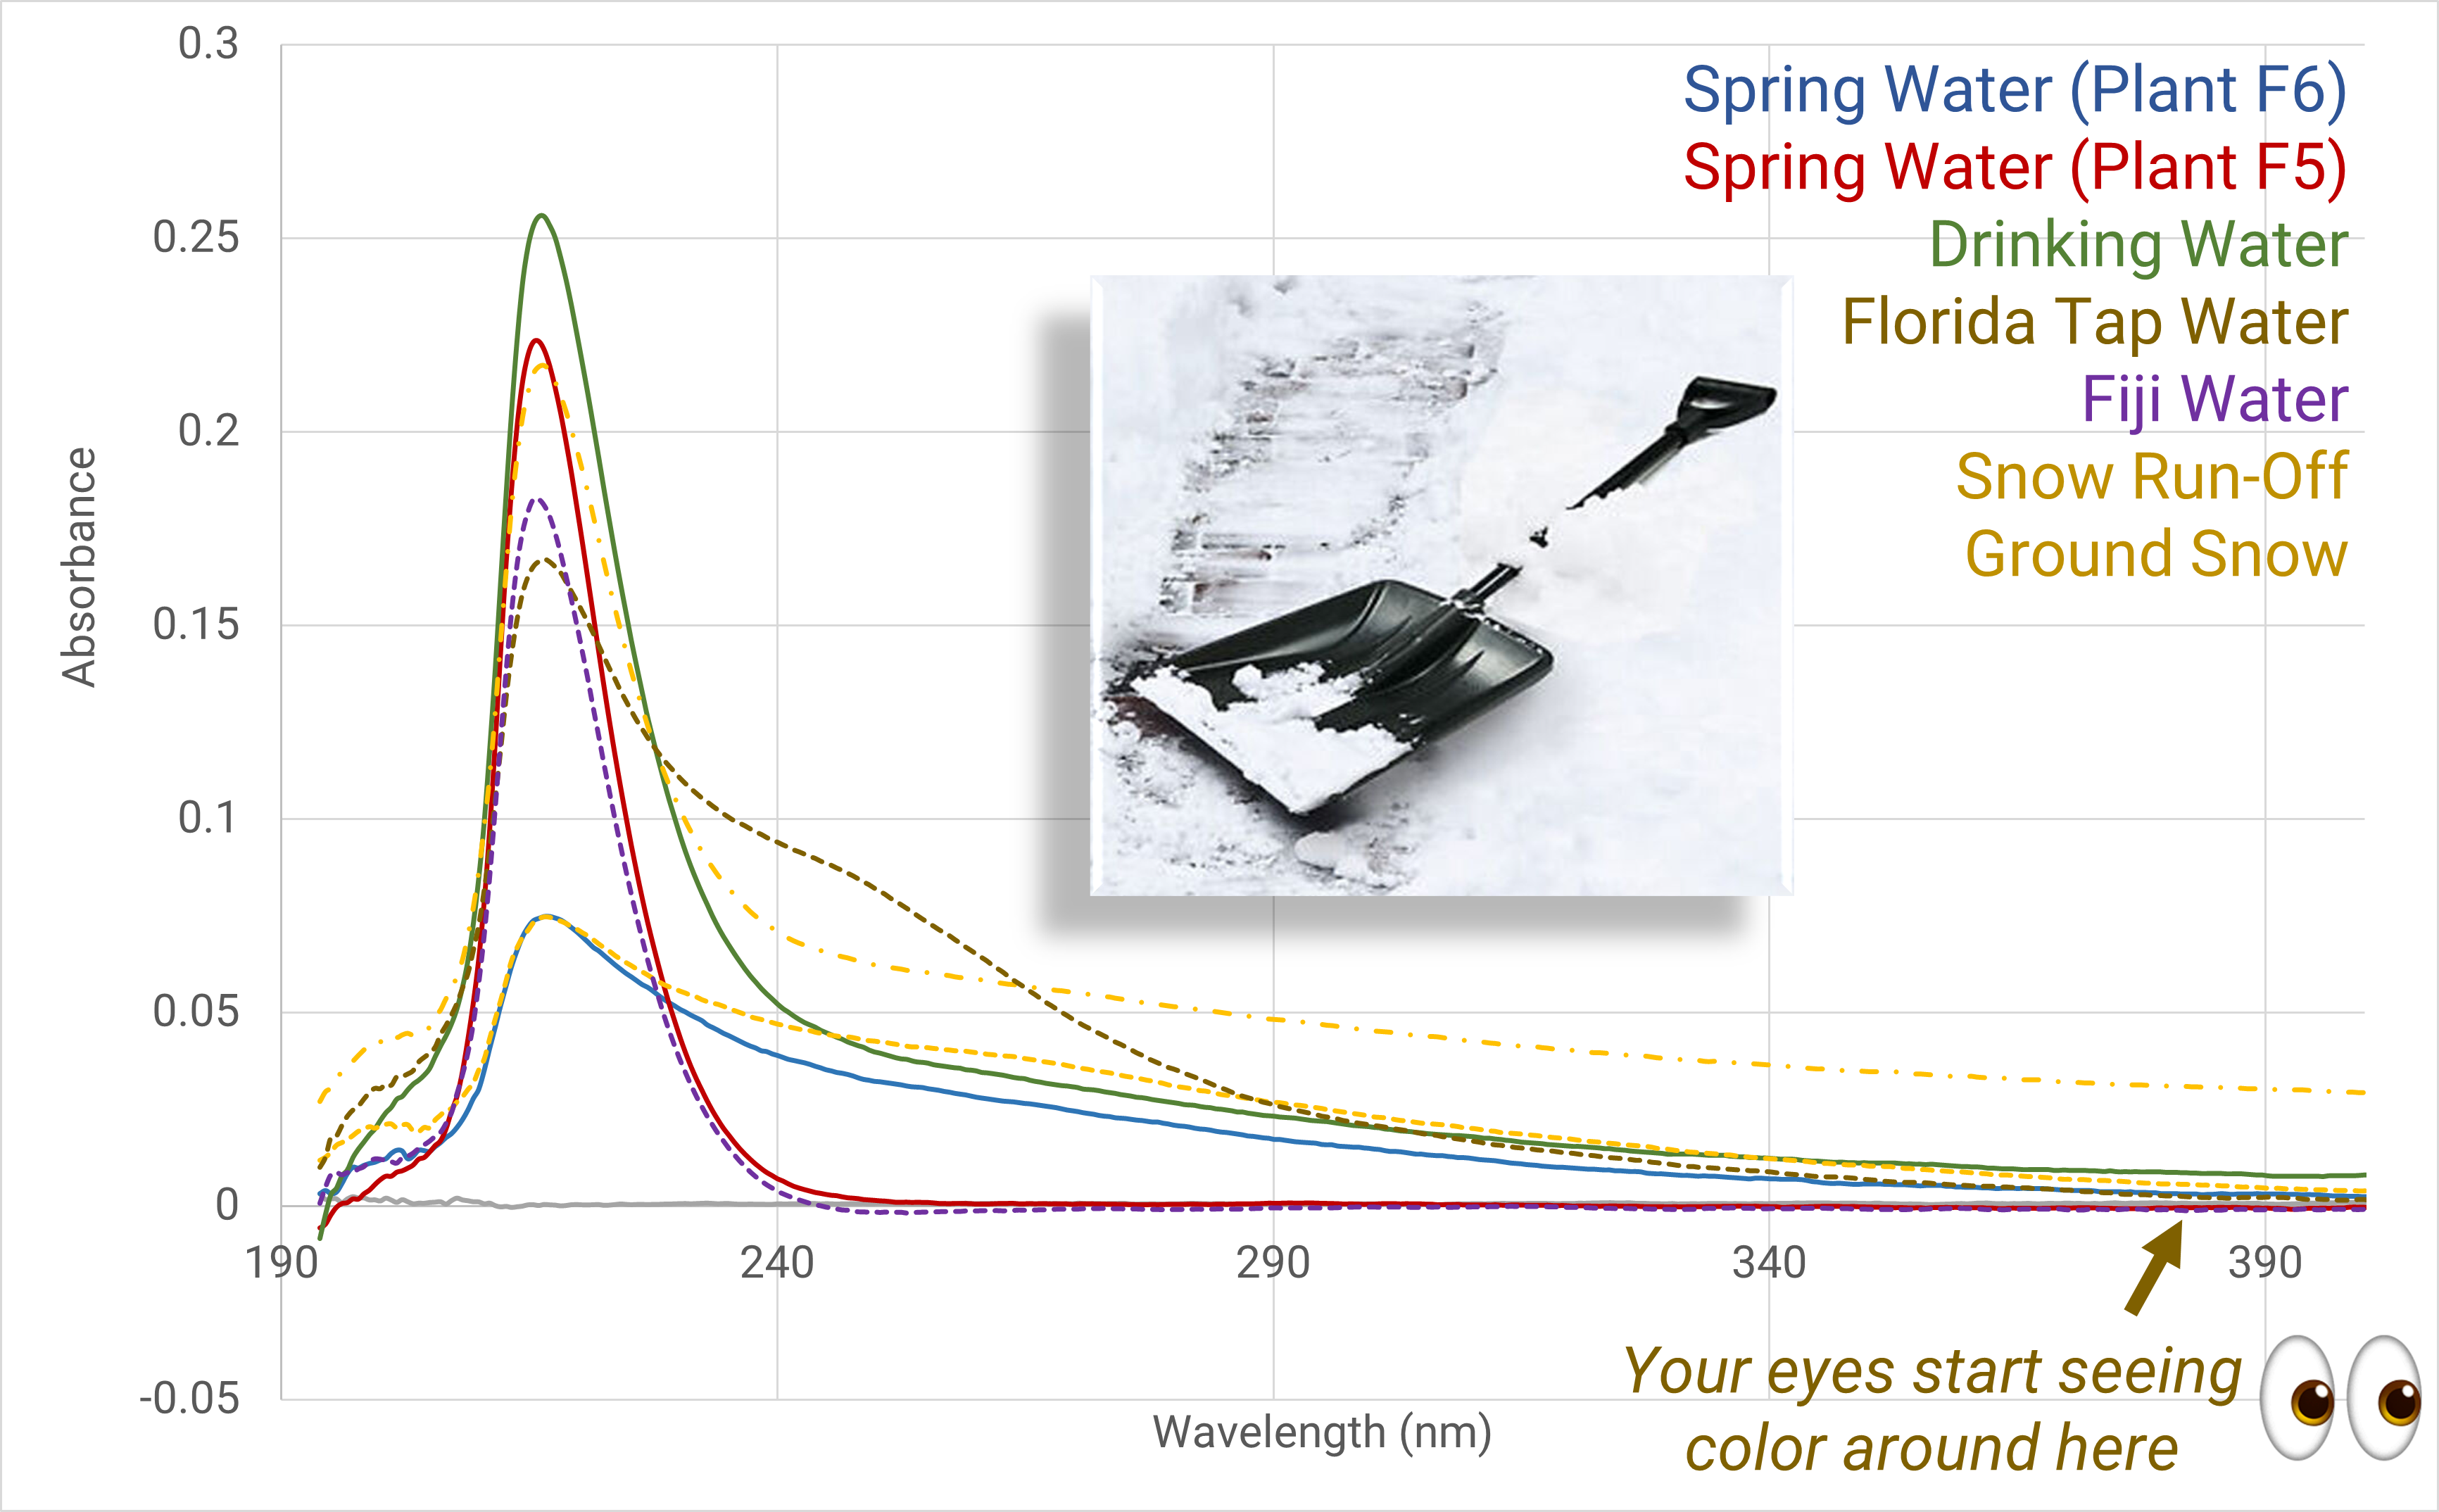
Figure 6. Ground snow, Mt. Spokane, Wash.
In contrast, the sample we collected from a Florida lake had such a strong response in the UV that the spectra are off-scale (Figure 7), which is suggestive of contaminants. It’s only when we rescale the results that we can fully appreciate the dramatic difference (Figure 8). This water quality level is similar to – and in many cases, better than – the only water available to nearly a billion people around the world.
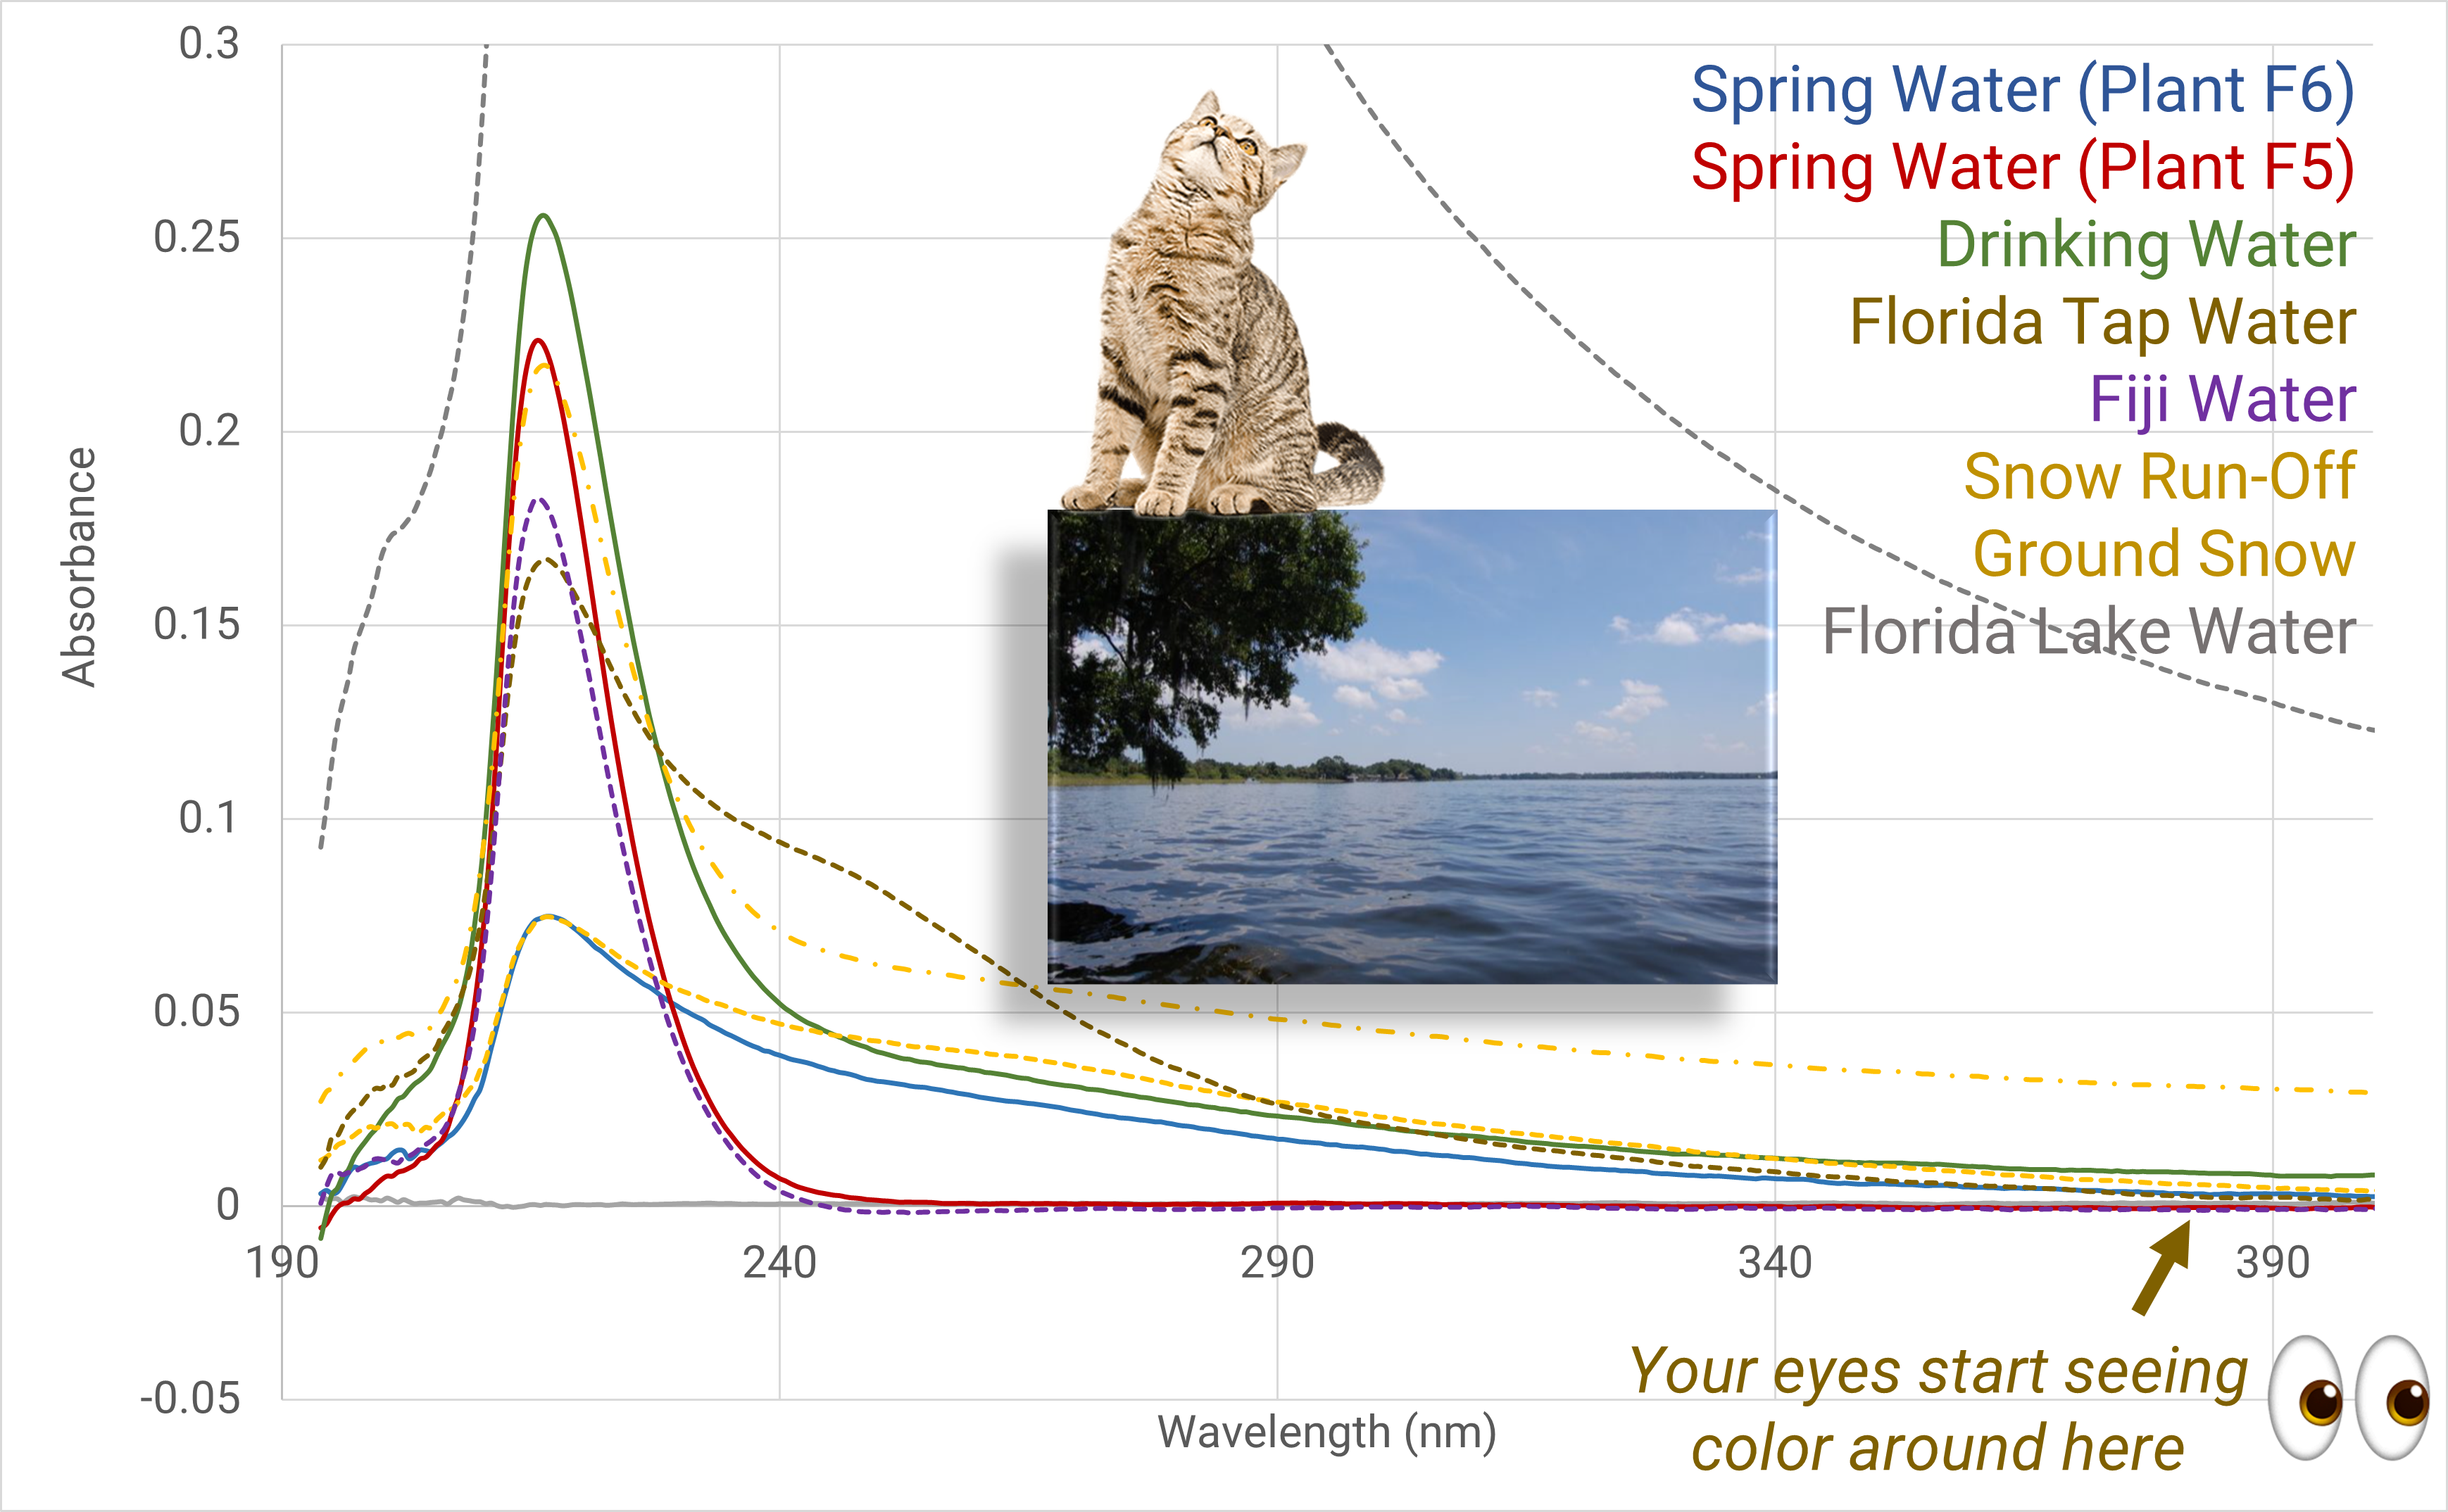
Figure 7. Lake water, St. Petersburg, Fla.
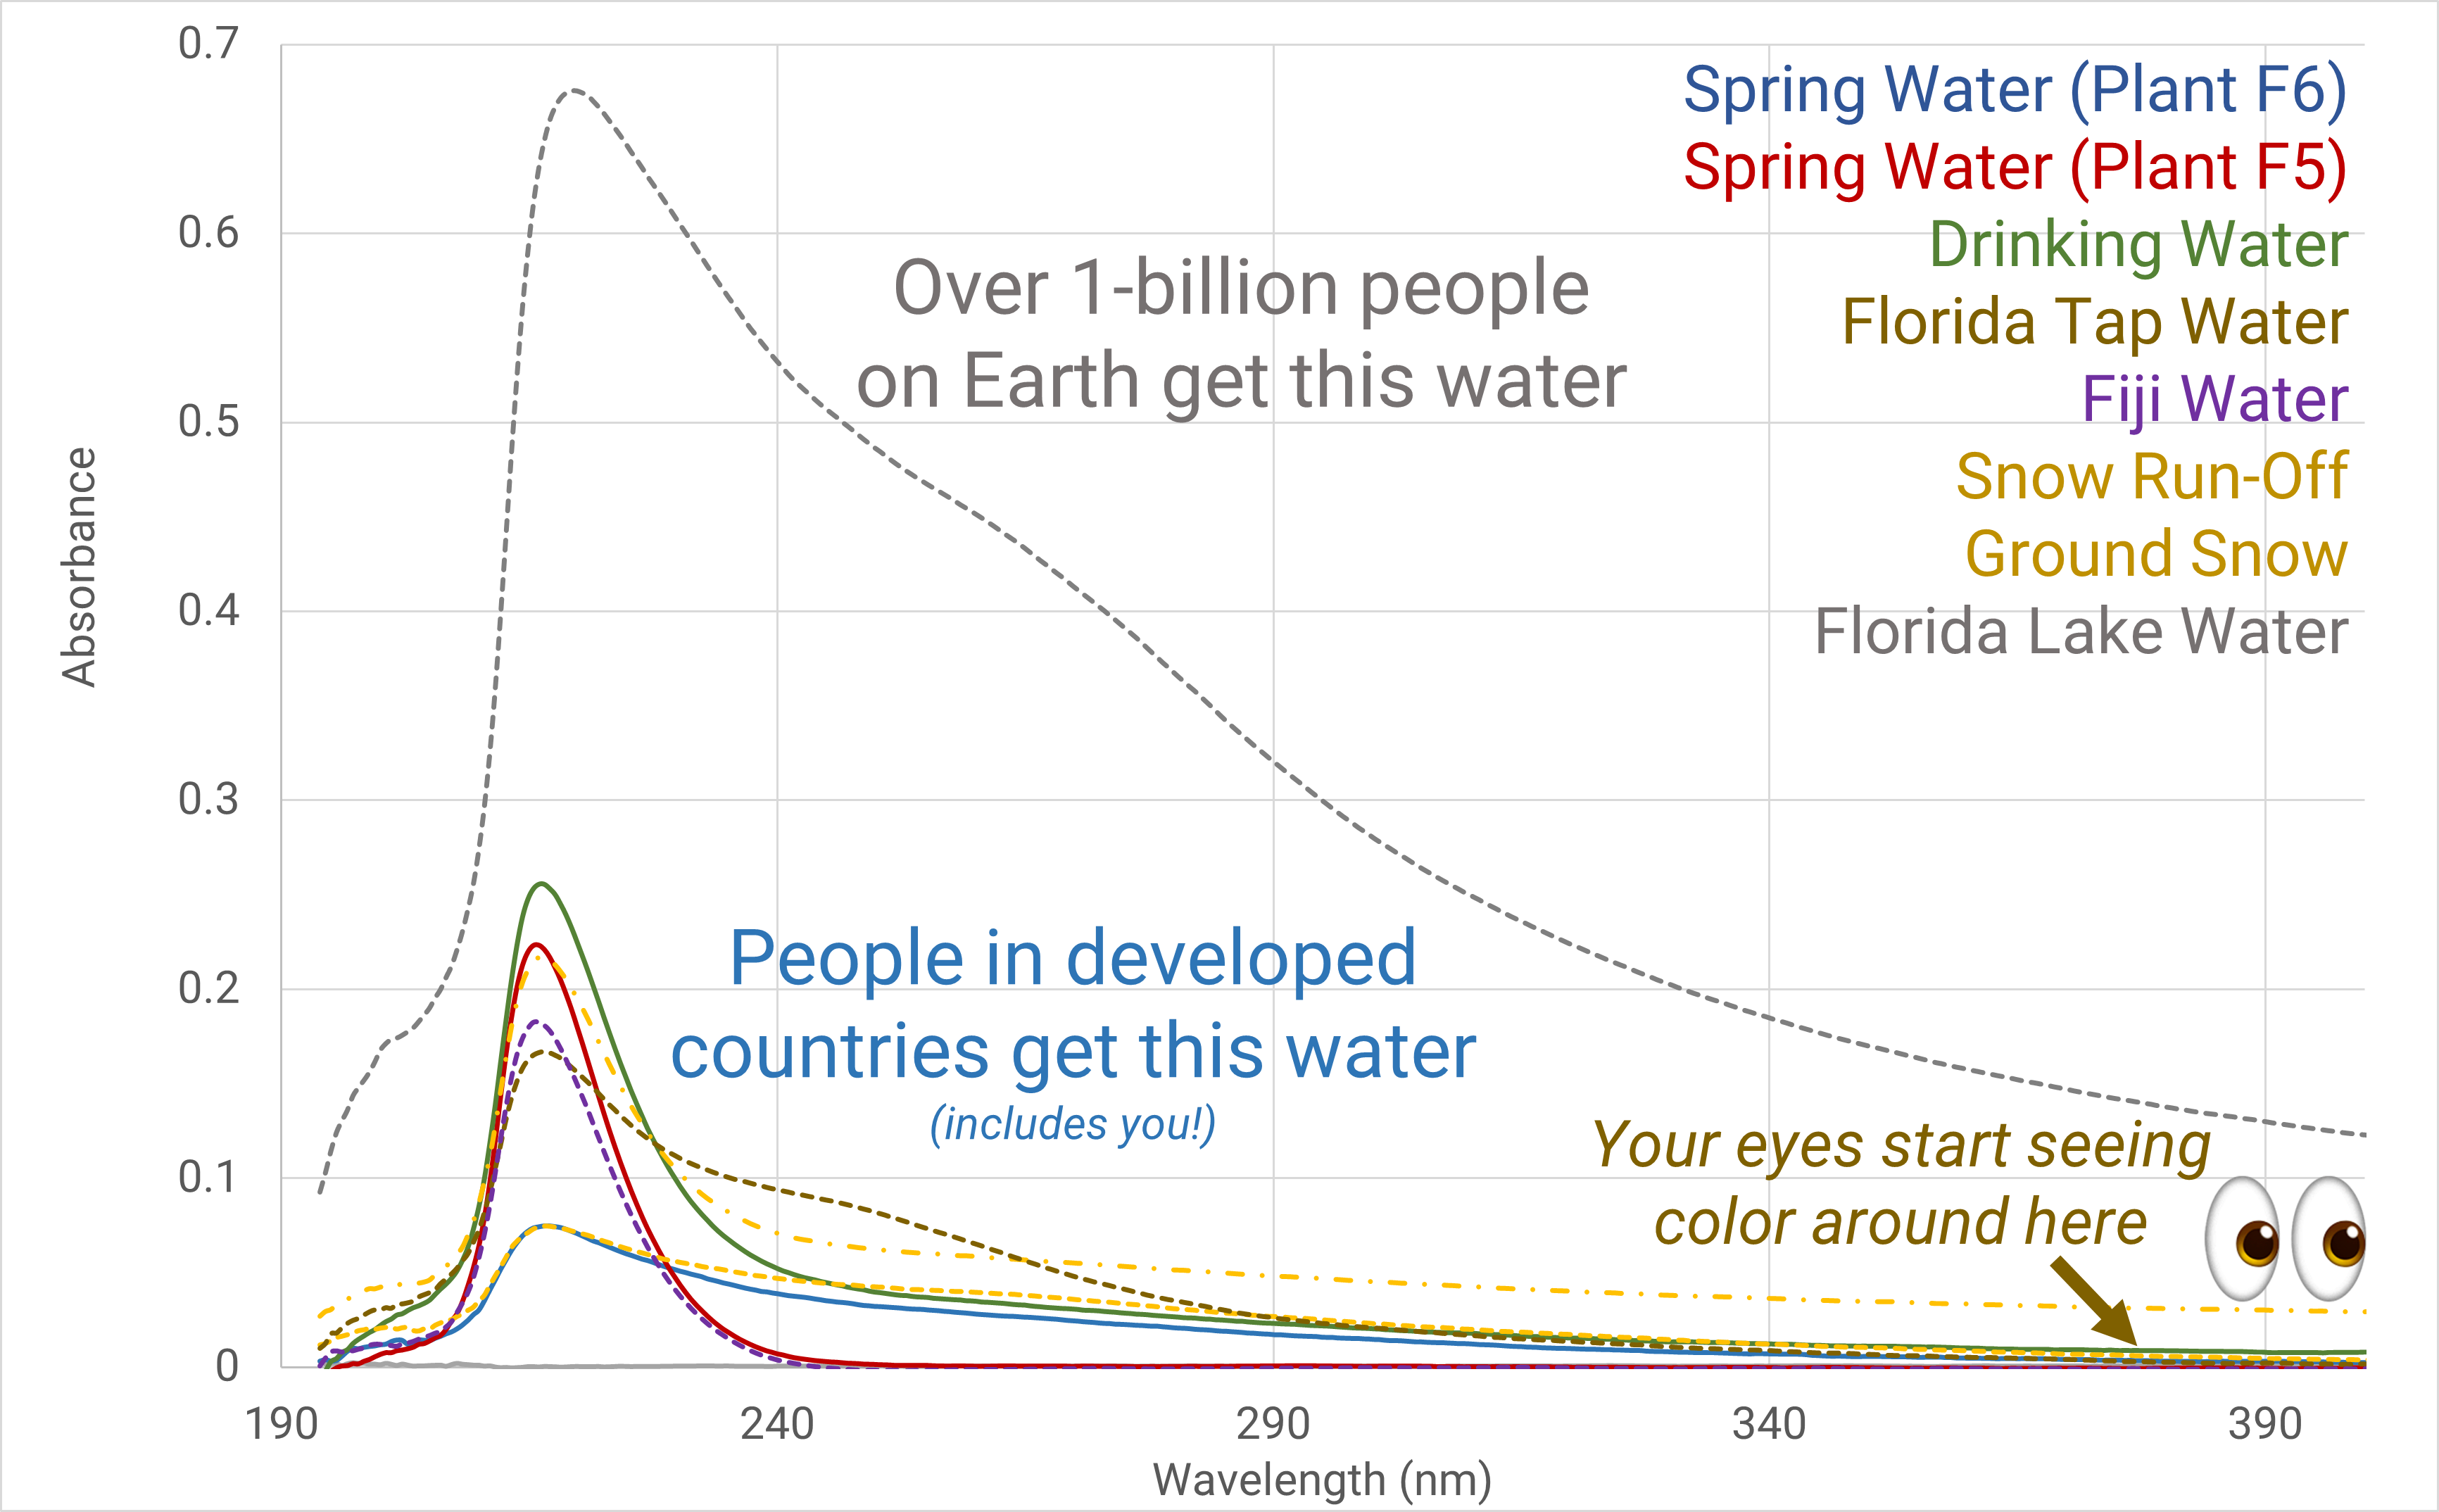
Figure 8. All water samples
But there are organizations like WaterAid that are helping to bridge the gap for the 1 in 10 people worldwide without access to clean water.
WaterAid is one of several international, charitable organizations dedicated to making clean water, decent toilets and good hygiene a normal part of everyday life for people everywhere. In conjunction with our parent company Halma plc, Ocean Insight is supporting a fundraising effort on behalf of WaterAid called Water for Life. The aim of this campaign is to transform lives in eastern India by bringing clean water to 8,000 people in Bihar, a remote area with limited access to safe drinking water.

Receive updates from our team as we share application notes, customer spotlights, educational tools, spectroscopy how-to’s, and more.