Subscribe to Our Blog
Receive updates from our team as we share application notes, customer spotlights, educational tools, spectroscopy how-to’s, and more.
In this application, a 785 nm Raman spectroscopy system is evaluated as a tool for monitoring the curing processes of ophthalmic materials used in surgeries. Precise monitoring of curing rates can improve quality and safety.
IMPORTANT: PLEASE REFRESH YOUR BROWSER IF YOU DO NOT SEE ANY IMAGES/SCREENSHOTS/SPECTRA ON THE PAGE.
With aging populations and the increasing prevalence of eye disease, the global ophthalmic industry has become a multibillion-dollar marketplace. For manufacturers of lenses used in eye surgery – for example, intraocular lenses (IOLs) for cataracts – simple tools and methods utilizing spectroscopy can speed development of newer, more effective ophthalmic materials.
To evaluate the viability of 785 nm Raman spectroscopy to characterize the curing process in ophthalmic materials, we used a modular Raman setup to measure a mixture of compounds irradiated by a curing lamp. Multiple measurements were conducted over varying levels of exposure time. Based on several clear indicators of polymerization revealed in the data, we proved that Raman spectroscopy can be effective as a QC tool to characterize the ophthalmic materials before they are used by surgeons in the hospital.
The ophthalmic materials mixture was placed in a vial and irradiated by a UV curing lamp. The mixture was measured immediately after being prepared without UV curing, and then measured after UV curing at intervals of 1, 5, 10, 15, 20 and 30 minutes.
A dark reference with the laser off was collected, and then the sample was interrogated with ~380 mW laser power. While the raw spectra were collected over 1 second integration time, an algorithm in OceanView spectroscopy software known as “CleanPeaks” was applied to remove the baseline and any fluorescence. The raw data was also manipulated by standard normal variate (SNV) processing as an alternative baseline-removal method. SNV involves subtracting the data by the average over a certain range, divided by the standard deviation over that same range. (Learn more about CleanPeaks, SNV and other useful Raman spectra processing tips).
To understand changes in the Raman spectra as the compounds were cured over time, this data was compared to previously collected spectra of the individual components, which included monomers and a cross-linker, UV absorber, and photoinitiator. This helped us to evaluate the effects of polymerization on the molecular structures for each of these compounds, as their Raman intensity changes during the curing process.
Our analysis revealed two regions of particular interest: ~1620-1650 cm-1 and 1710-1745 cm-1. For the former, polymerization of the compounds PEA and PEMA leads to consumption of the carbon-carbon double bond (C=C), which allows the carbons to bind to other molecules. Based on typical Raman band frequencies reported in the literature, a peak within ~1620-1650 cm-1 is assigned to the C=C stretching vibration1. As the mixture samples are cured, the intensity of a peak at 1632 cm-1 decreases with time. A study by Lui et al. revealed that monitoring the evolution of the 1632 cm-1 band can be used to characterize the curing process, where the intensity decreases with curing time due to consumption of the C=C bond as polymerization occurs2.
Another peak of interest occurs in the range from 1710-1745 cm-1 and is attributed to the C=O stretching vibration1. This peak appears at different wavenumbers for each compound and shifts slightly over the first five minutes of curing time.
We also investigated the Raman response of the photoinitiator to determine if a signature peak could be used to monitor the extent of polymerization, but it appears the material is used up after UV curing.
Polymerization of ophthalmic materials exposed to UV light was monitored using Raman spectroscopy. The evolution of a Raman band at 1632 cm-1 was used to determine the extent of C=C bond consumption as the molecules were polymerized. Another band, at 1720 cm-1, indicates C=O stretching and was used as an internal standard to help calculate the conversion rate of the polymer based on the intensity of the 1632 cm-1 band (Figure 1). Other bands were investigated to determine a contribution from the photoinitiator but a clear trend in the data could not be determined. Additional insight could be gleaned from analyzing the curing process time in more detail, focusing on the time scale up to 10 minutes.
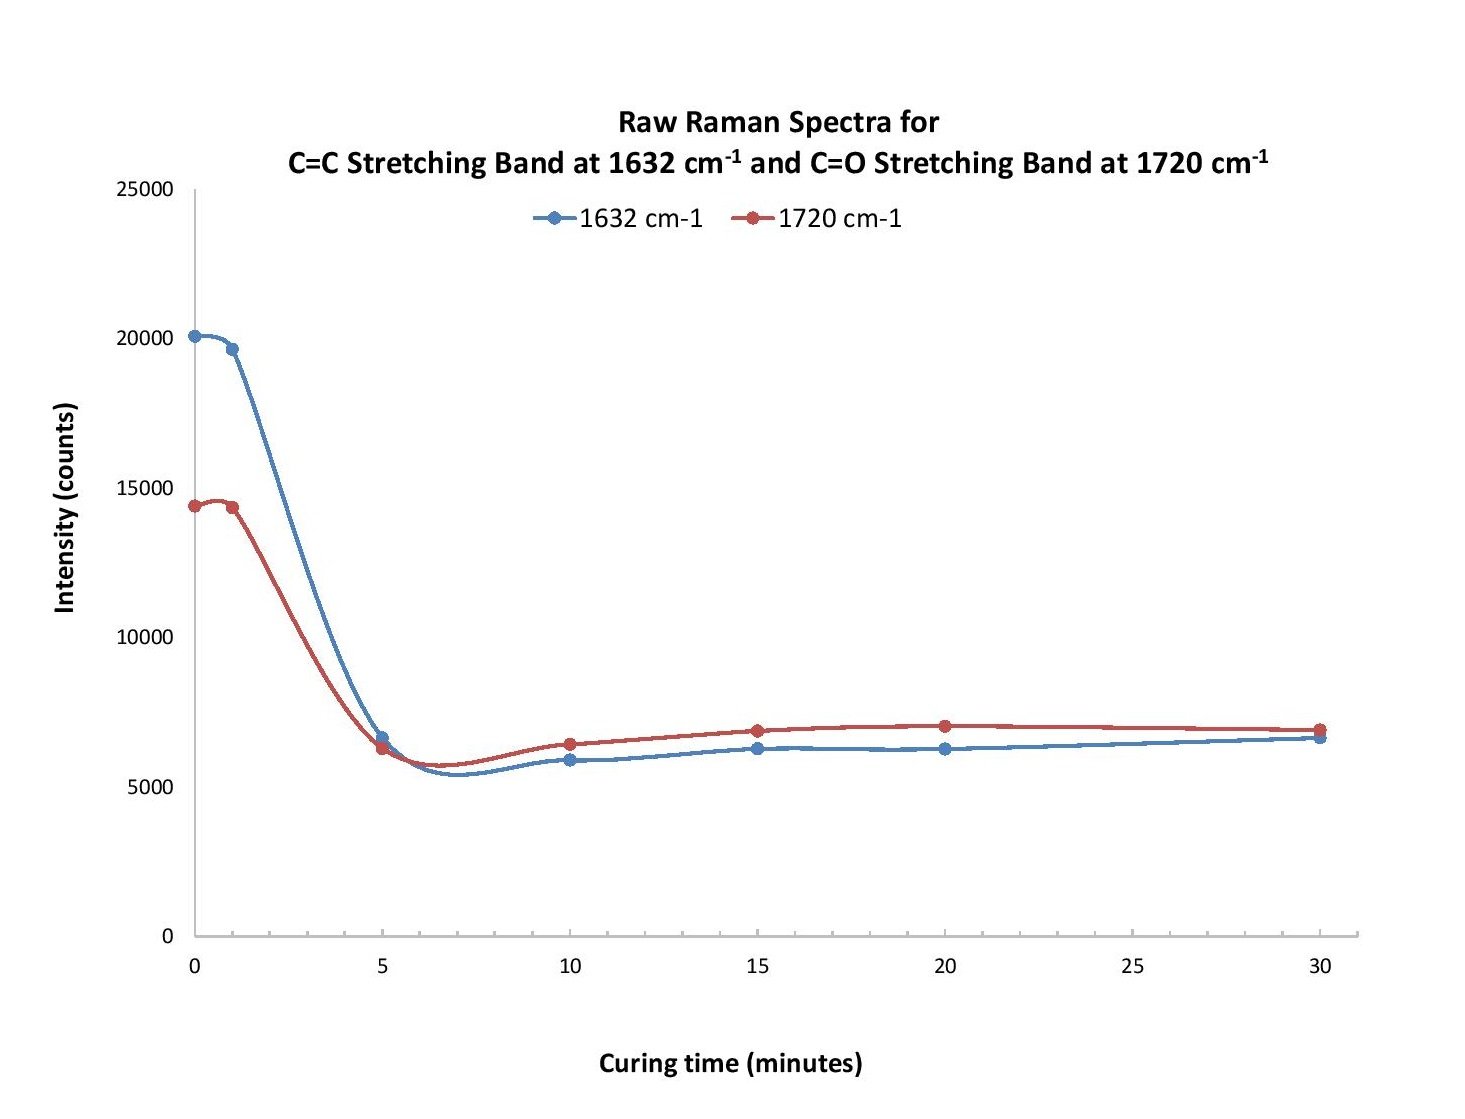
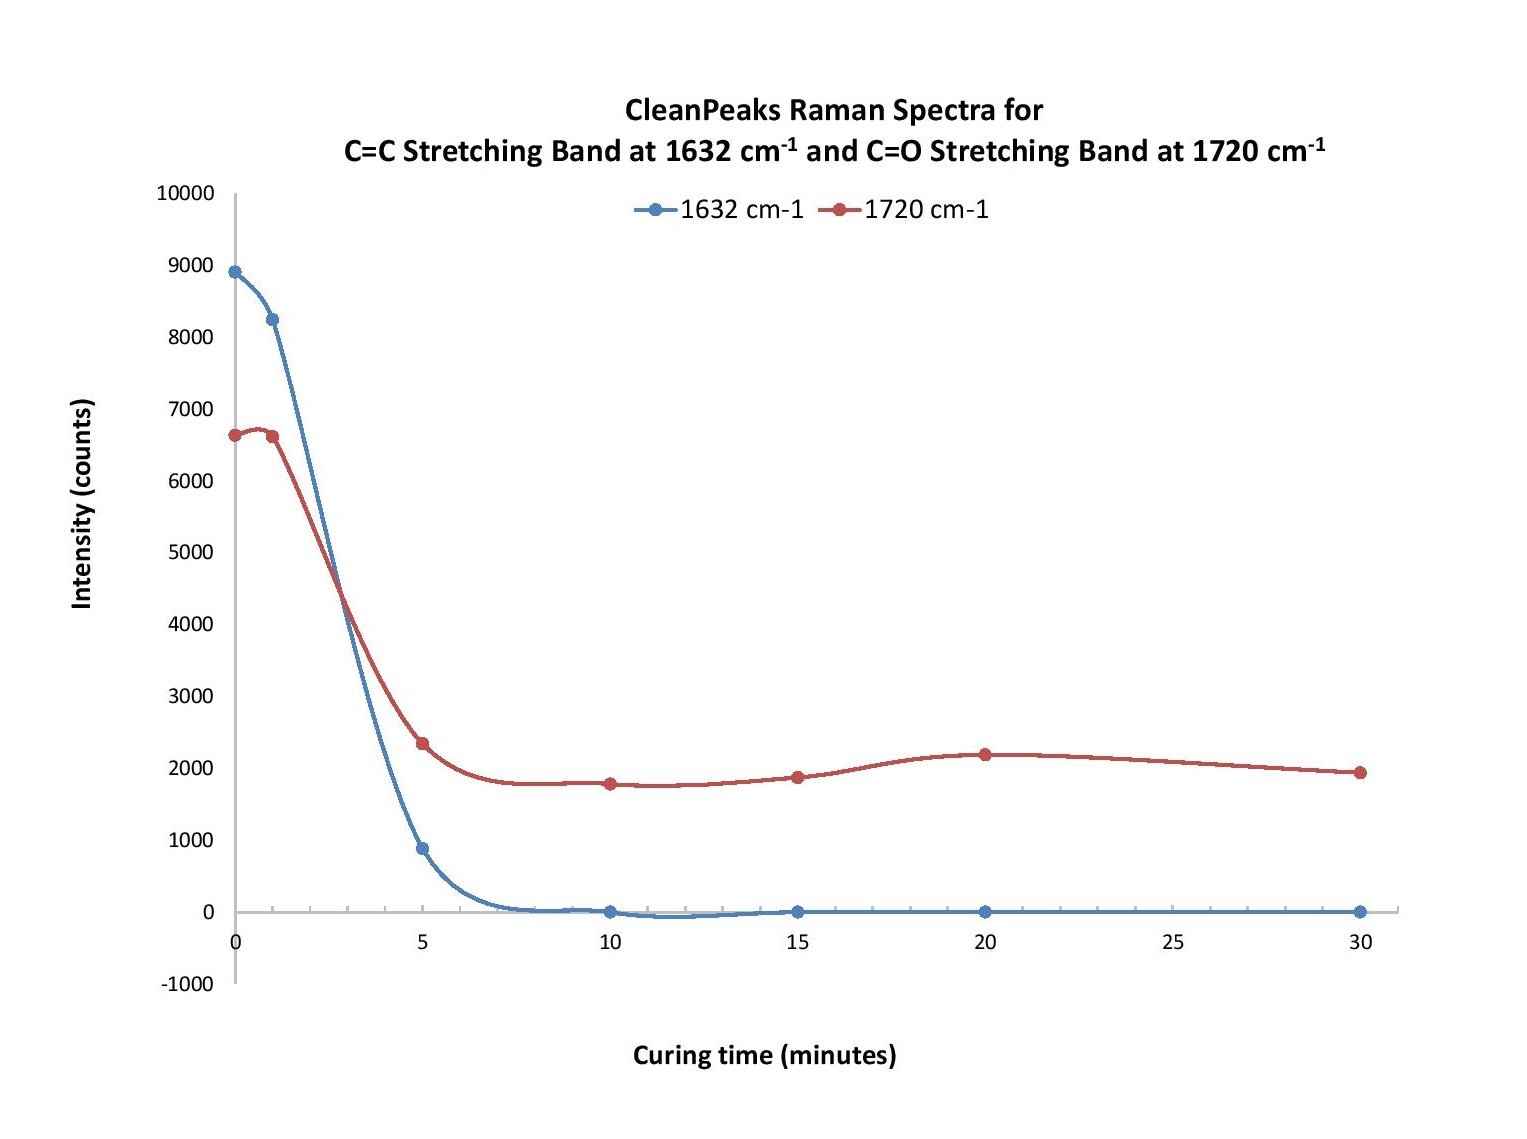
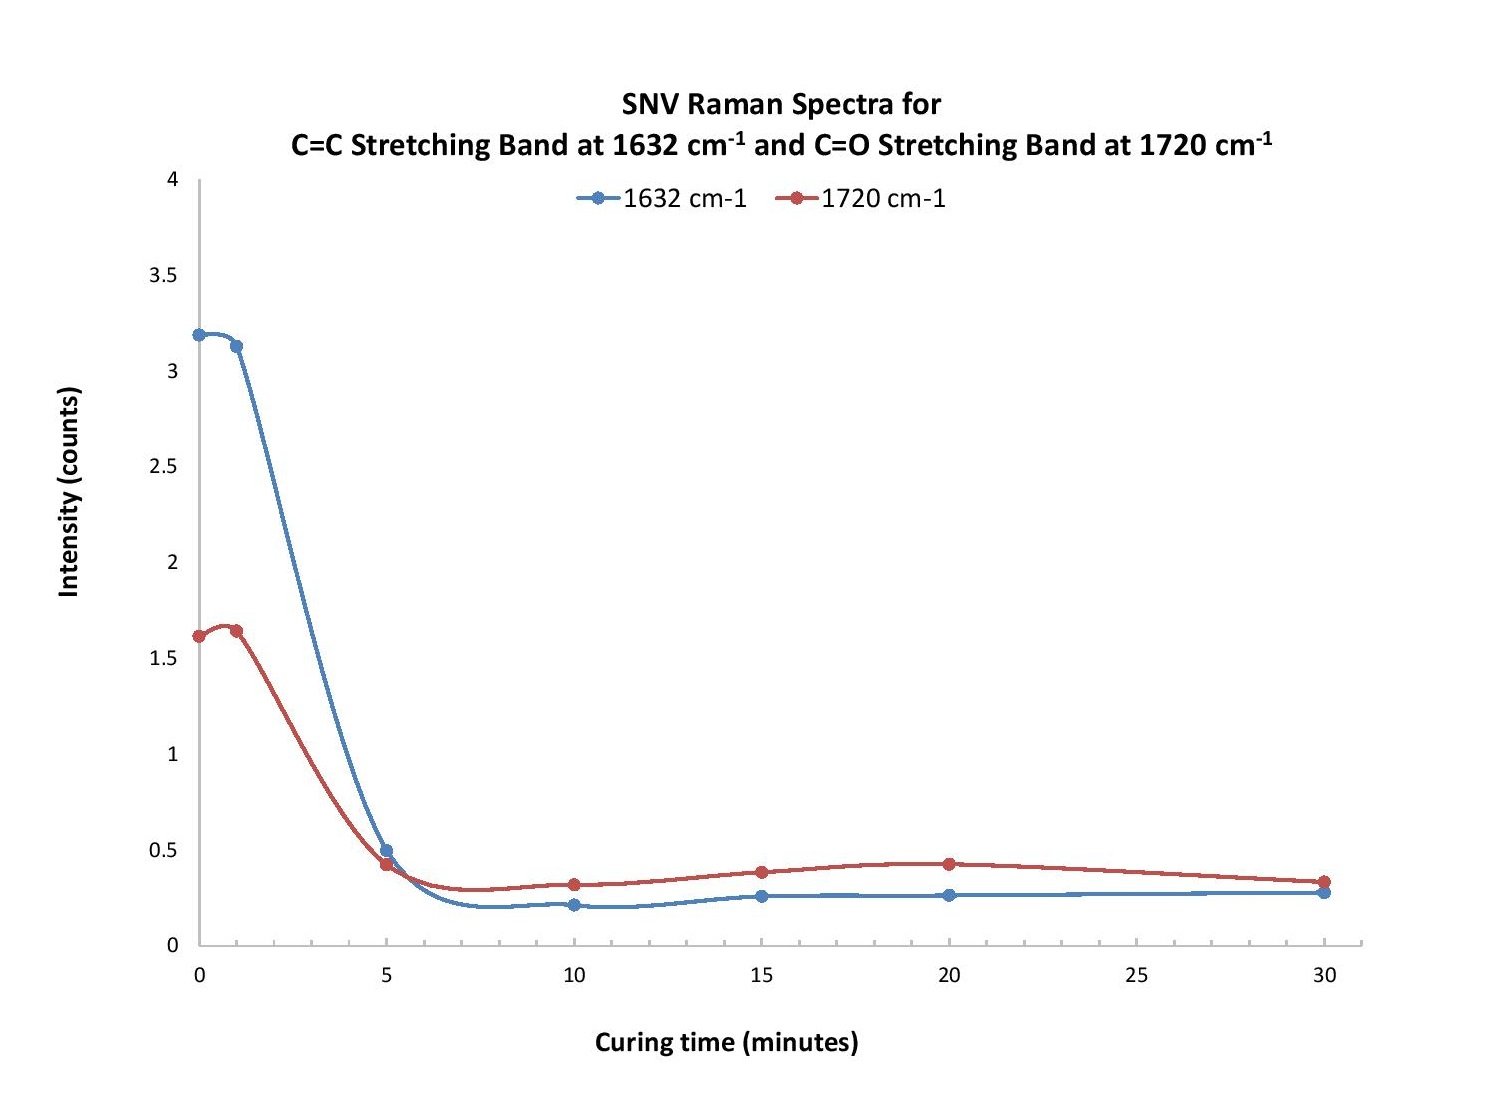
Figure 1. At 1632 cm-1 and 1720 cm-1, intensity from the raw (a), CleanPeaks (b), and SNV (c) Raman spectra for the C=C and C=O stretching bands was plotted as a function of curing time. We observed a similar response trend for each.
Considering that 10 milion cataract surgeries alone are performed annually around the world, any steps taken to ensure successful post-operative results can have a major impact on quality of life. In addition to speeding up lens development time, careful control of curing processes in ophthalmic materials could prevent issues associated with bending and distortion of cured materials, and could help reduce curing lamp use by minimizing the tendency to over-expose materials.

1. Socrates, G. Infrared and Raman Characteristic Group Frequencies, Third Edition, John Wiley & Sons, LTD, 2001.
2. Liu, F., Wang, Y, Xue, X. and Yang, H. Photopolymerization of UV Curable Coatings Monitored by Raman Spectroscopy. Polymer(Korea), 2016, 40, 390-396.
QE Pro Preconfigured Raman Spectrometers
Options available
Raman Sample Holders
Prices From $715.00
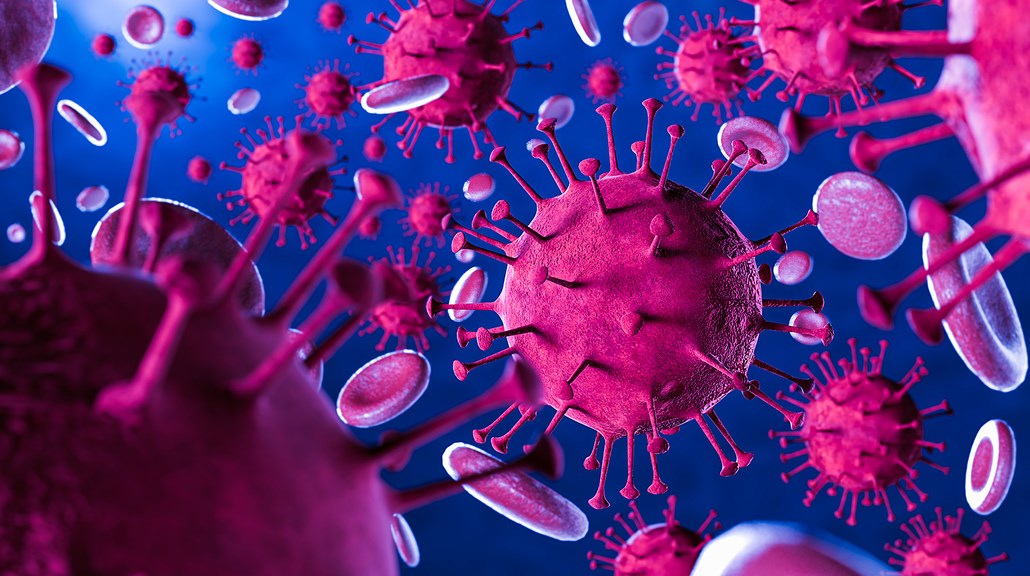
Explore the optical sensing tools and techniques available for virus detection. Our focus? Rapid testing and screening for viruses including COVID-19.
Learn how researchers at Ghent University in Belgium are using UV spectroscopy as part of their research efforts to find answers for a faster and more effective cataract diagnosis.

Receive updates from our team as we share application notes, customer spotlights, educational tools, spectroscopy how-to’s, and more.