Subscribe to Our Blog
Receive updates from our team as we share application notes, customer spotlights, educational tools, spectroscopy how-to’s, and more.

Sorting Polymers by Unique Spectral Features
This application note was written by Yvette Mattley, Ph.D., and Derek Guenther.
With their widespread use and near ubiquitous presence in our daily lives, plastics enjoy a high level of public awareness – both positive and negative. One area of special interest among folks of all perspectives – from researchers and manufacturers to environmentalists and regulators -- is plastics recycling.
In this application note, we explore how spectroscopy can be used in plastics recycling to identify and sort a variety of plastics with a high degree of specificity.
The synthetic materials comprising some plastics use macromolecules such as polymers. These polymers are commonly manufactured through injection molding at low temperatures, suggesting that reuse of the materials via recycling is simple. However, very few types of plastics can be blended into homogeneous mixtures, which makes it necessary to cleanly separate the different polymers in the recycling stream.
Because techniques like NIR spectroscopy and Raman analysis provide useful information about material characteristics including chemical composition, they’re effective in identifying plastics for recycling. Integration of spectroscopy into recycling streams can make processes simpler by mitigating the need for some sorting steps.
At NIR wavelengths (>800 nm), polymers have strong, distinct spectral features, which closely correlate to the recycling codes imprinted on plastics (Figure 1). Also, with NIR spectroscopy, there's very little sample preparation to be done. Setups are flexible and customizable to many different situations.
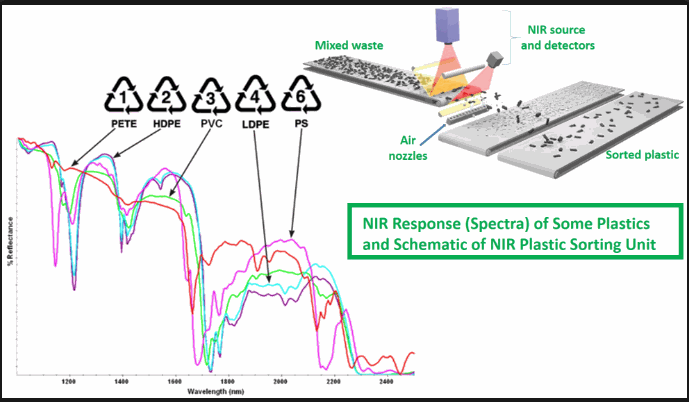
Figure 1. Most coded plastics have distinct spectral features in the NIR. Spectrometers can be integrated into recycling processes to help sort plastic types.
In some cases, Raman spectroscopy can be used to identify unknown compounds. Indeed, under the right conditions – i.e., at sufficient signal levels and with adequate methods to mitigate interference from fluorescence -- Raman is highly specific for plastics identification.
As effective as Raman and NIR spectroscopy can be for clear and colored plastics identification, neither method is well suited for identification of black polymers. That’s because carbon black absorbs all the Raman excitation laser light and all the light in the NIR region. However, there are references in the literature to the use of mid-IR spectroscopy techniques for identifying black polymers.1
For purposes of this application note, our focus is on NIR spectroscopy. To demonstrate the effectiveness of the Flame-NIR+ spectrometer for plastics identification, we measured the diffuse reflectance of several samples: PETE (polyethylene terephthalate), often used in containers and clothing; the thermoplastic LDPE (low-density polyethylene); PP (polypropylene), which has numerous everyday applications; and PS (polystyrene), which makes its way into all sorts of packaging and containers.
The Flame-NIR+ (Figure 2) has a compact, high-performance optical bench with an uncooled InGaAs array detector for spectral response from 970-1700 nm. It has up to 6x increased sensitivity compared with earlier models, offering lower limits of detection and allowing for shorter integration times.
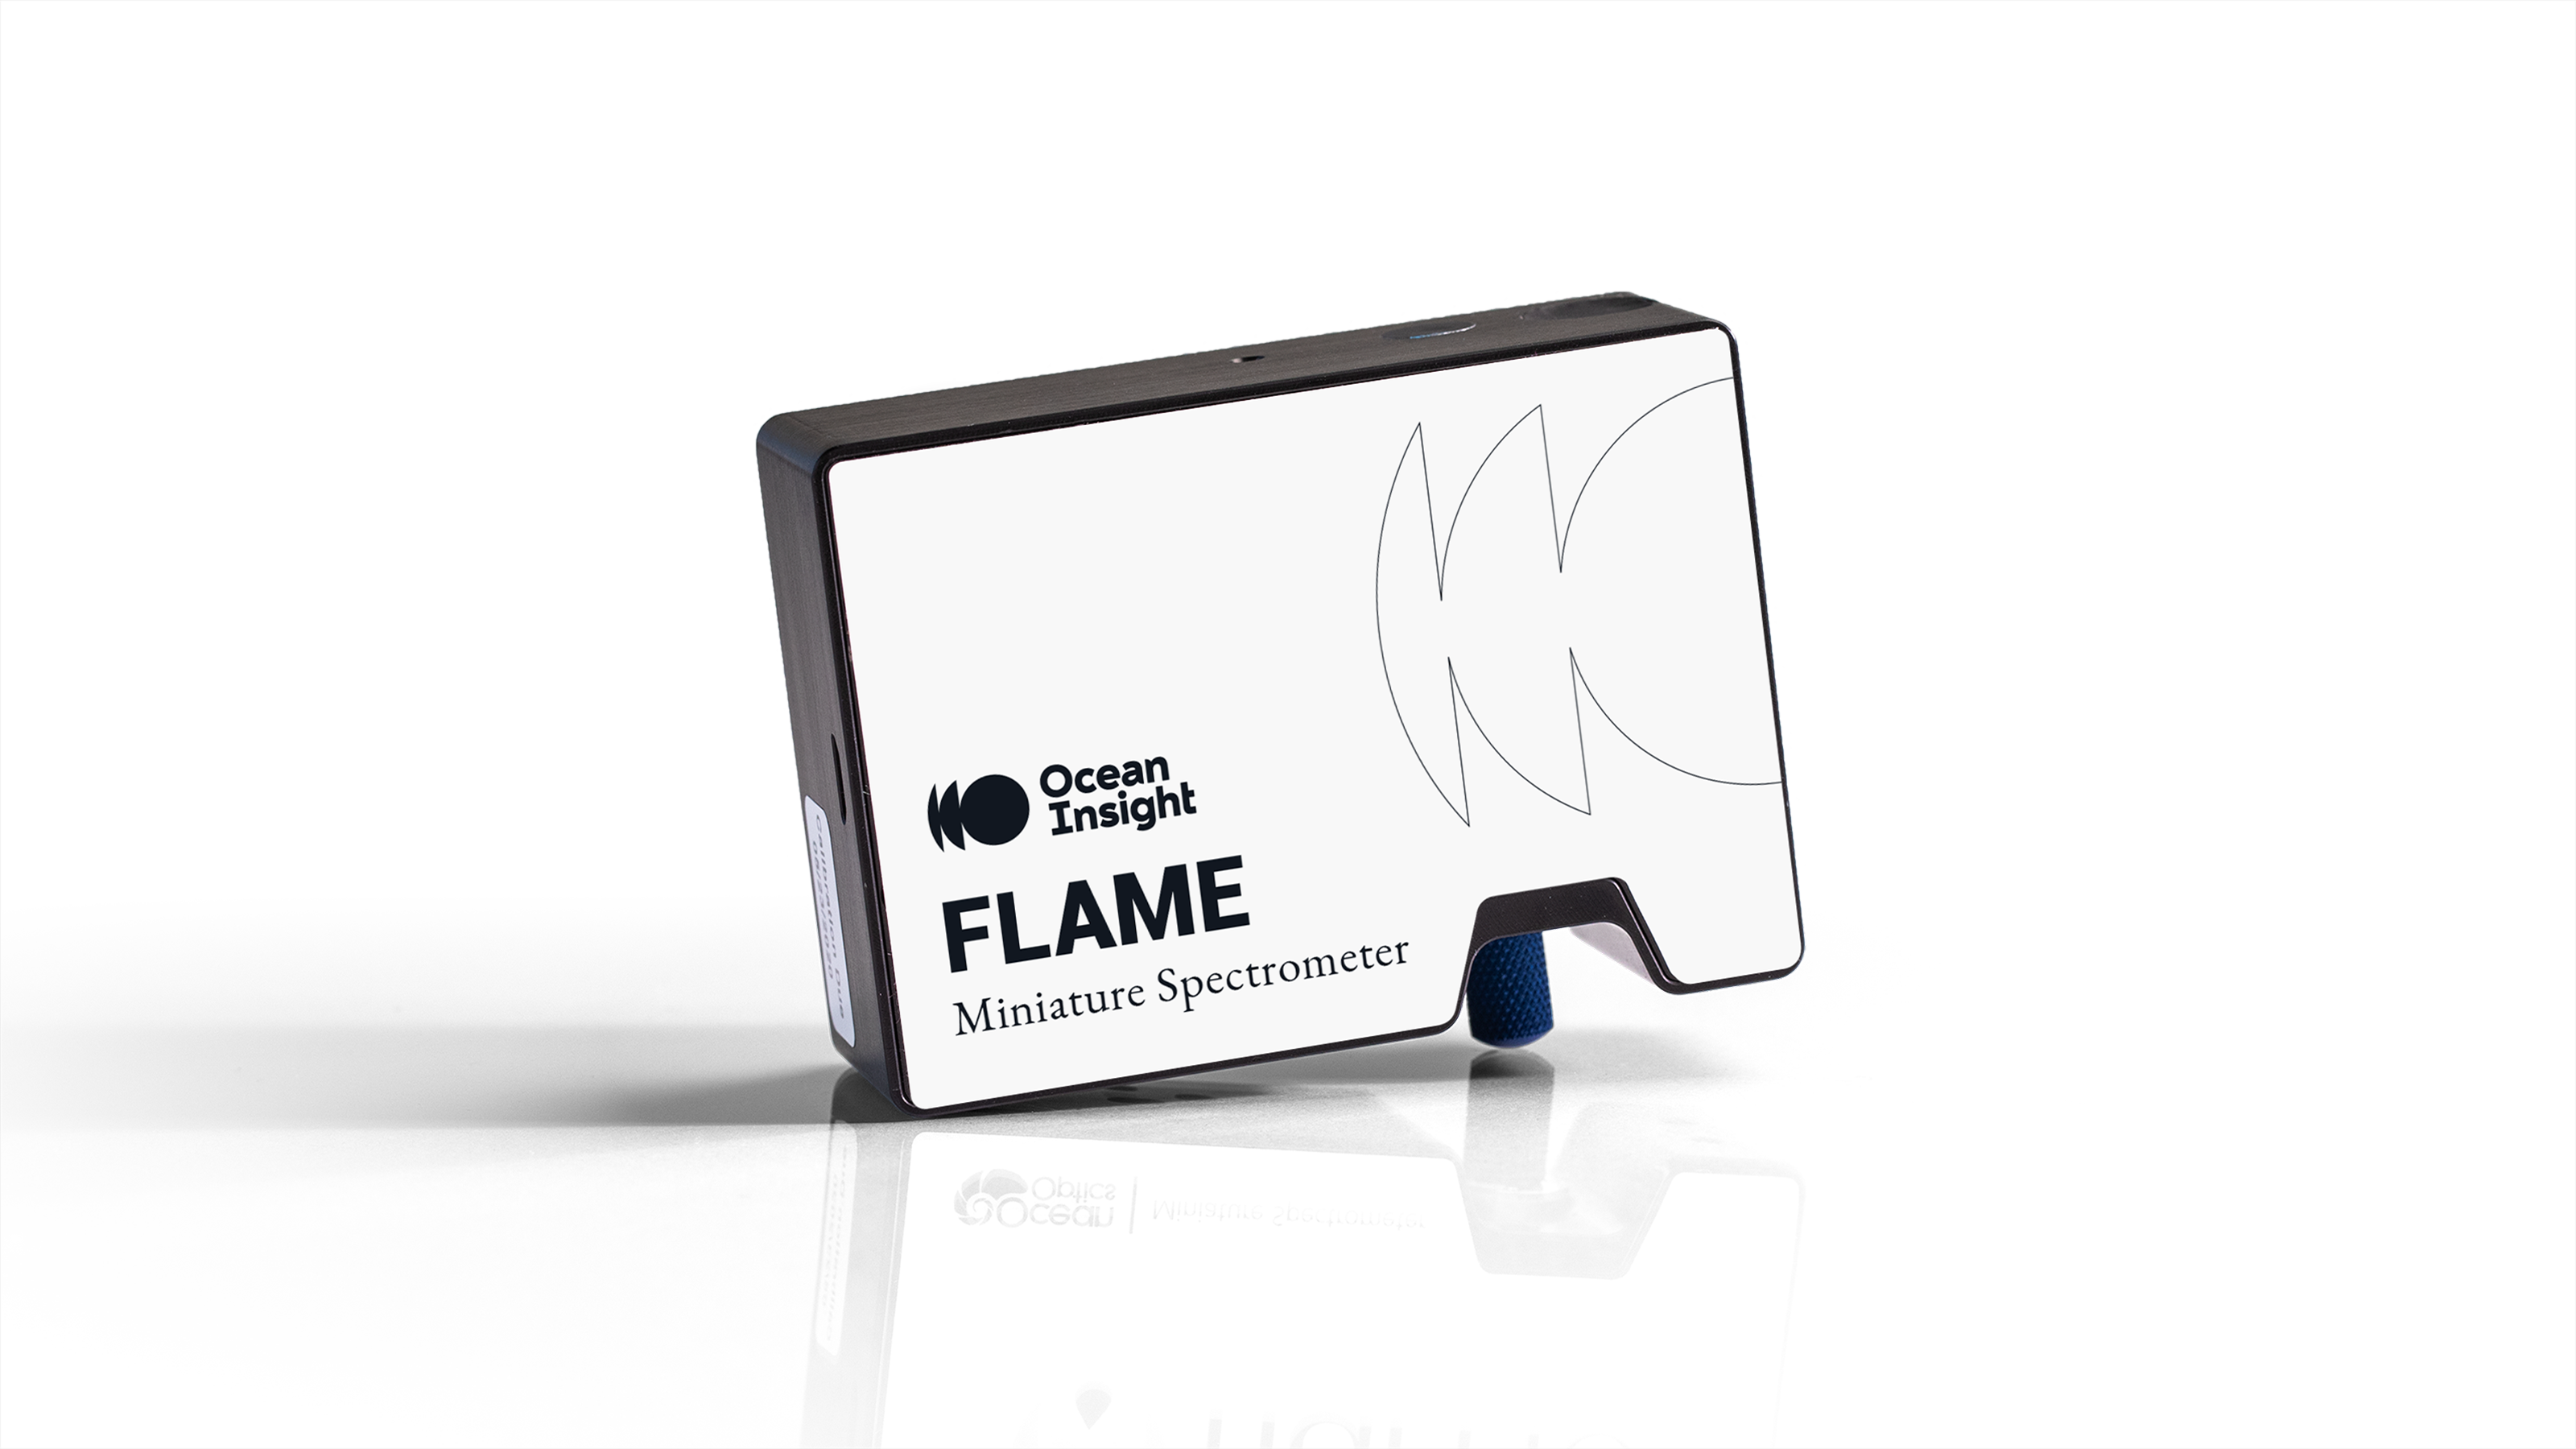
Figure 2. With its compact footprint and low power consumption needs, the Flame-NIR+ is an attractive option for integration into recycling streams.
To measure our samples, we used the Flame-NIR+ with a high-power tungsten halogen light source, 600 µm reflection probe and diffuse reflectance standard. OceanView operating software completed the setup. We set our parameters at 6 ms integration time, with 50 scans to average and boxcar width set to 1.
OceanView acquired data in absorbance mode, so we could plot log(1/R) of the reflectance spectra, with R being the reflectance of the sample. This can be a more intuitive way to show reflectance spectra for chemical analysis, as taking log(1/R) of the reflectance spectrum allows us to see concentration as scaling with signal intensity.
Initally, we collected Flame-NIR+ spectra without applying baseline correction (Figure 3). To make it easier to discern spectral features, we did a baseline correction by subtracting the reflectance at 1303 nm from every data point in the spectrum. This is a data processing step that helps to eliminate the intensity offset that can result from fibers moving or other issues, making it easier to examine differences in spectral shapes (Figure 4).
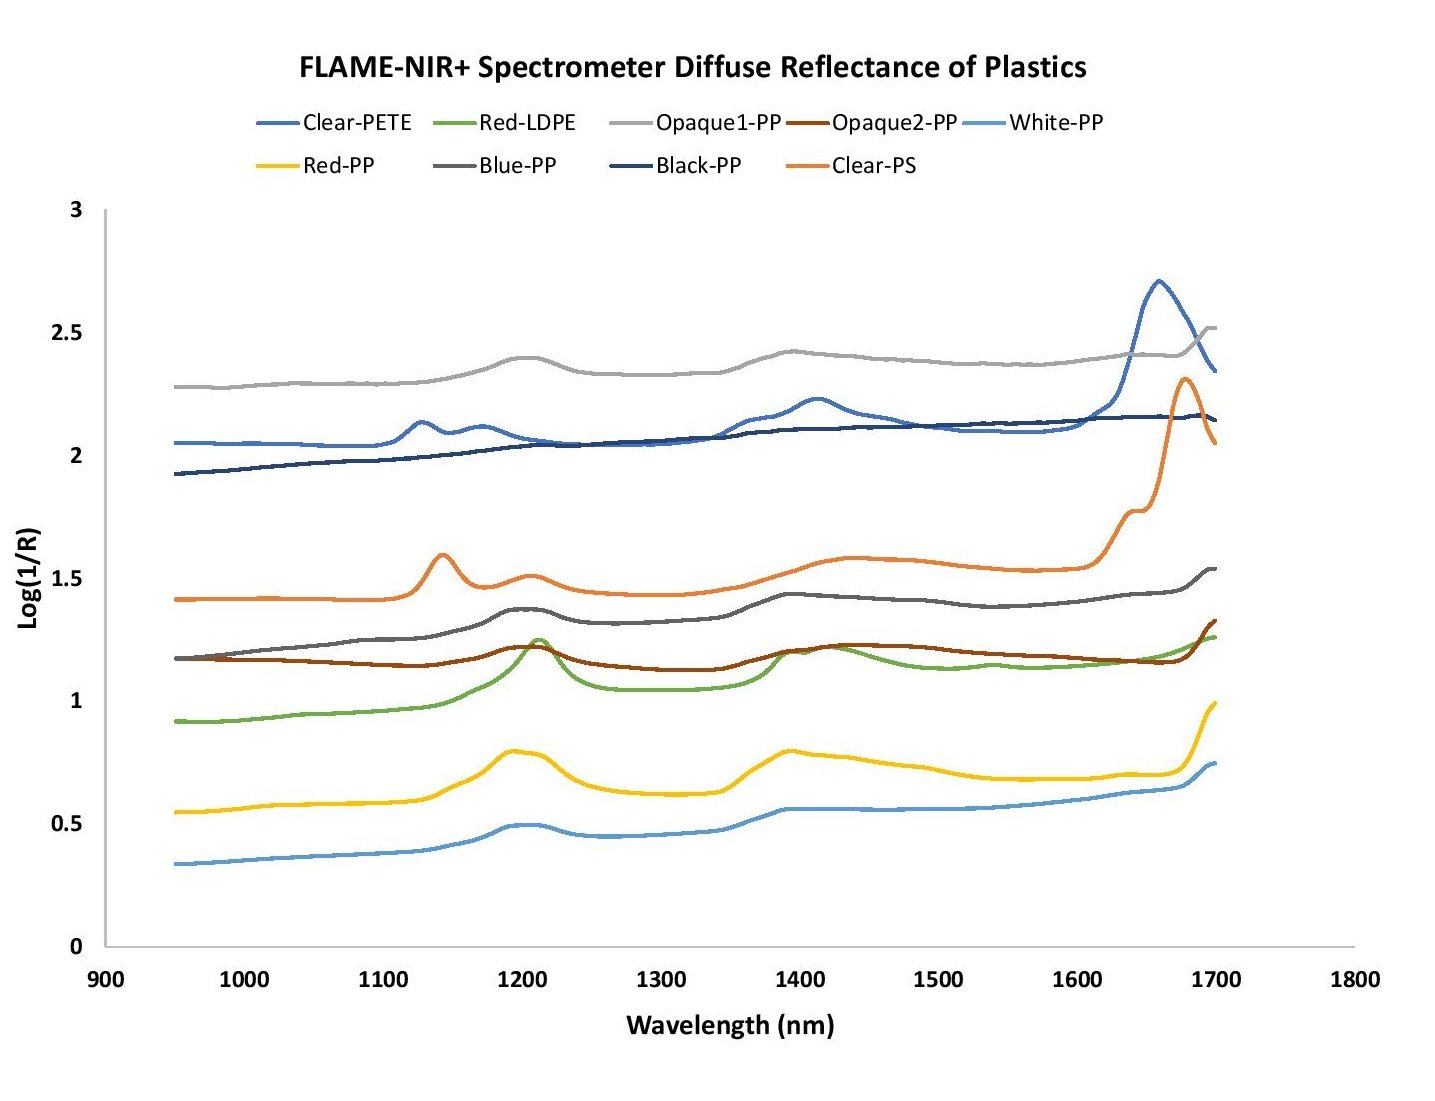
Figure 3. Diffuse reflectance of plastic samples using the Flame-NIR+ spectrometer (970-1700 nm). Data is shown without baseline correction.
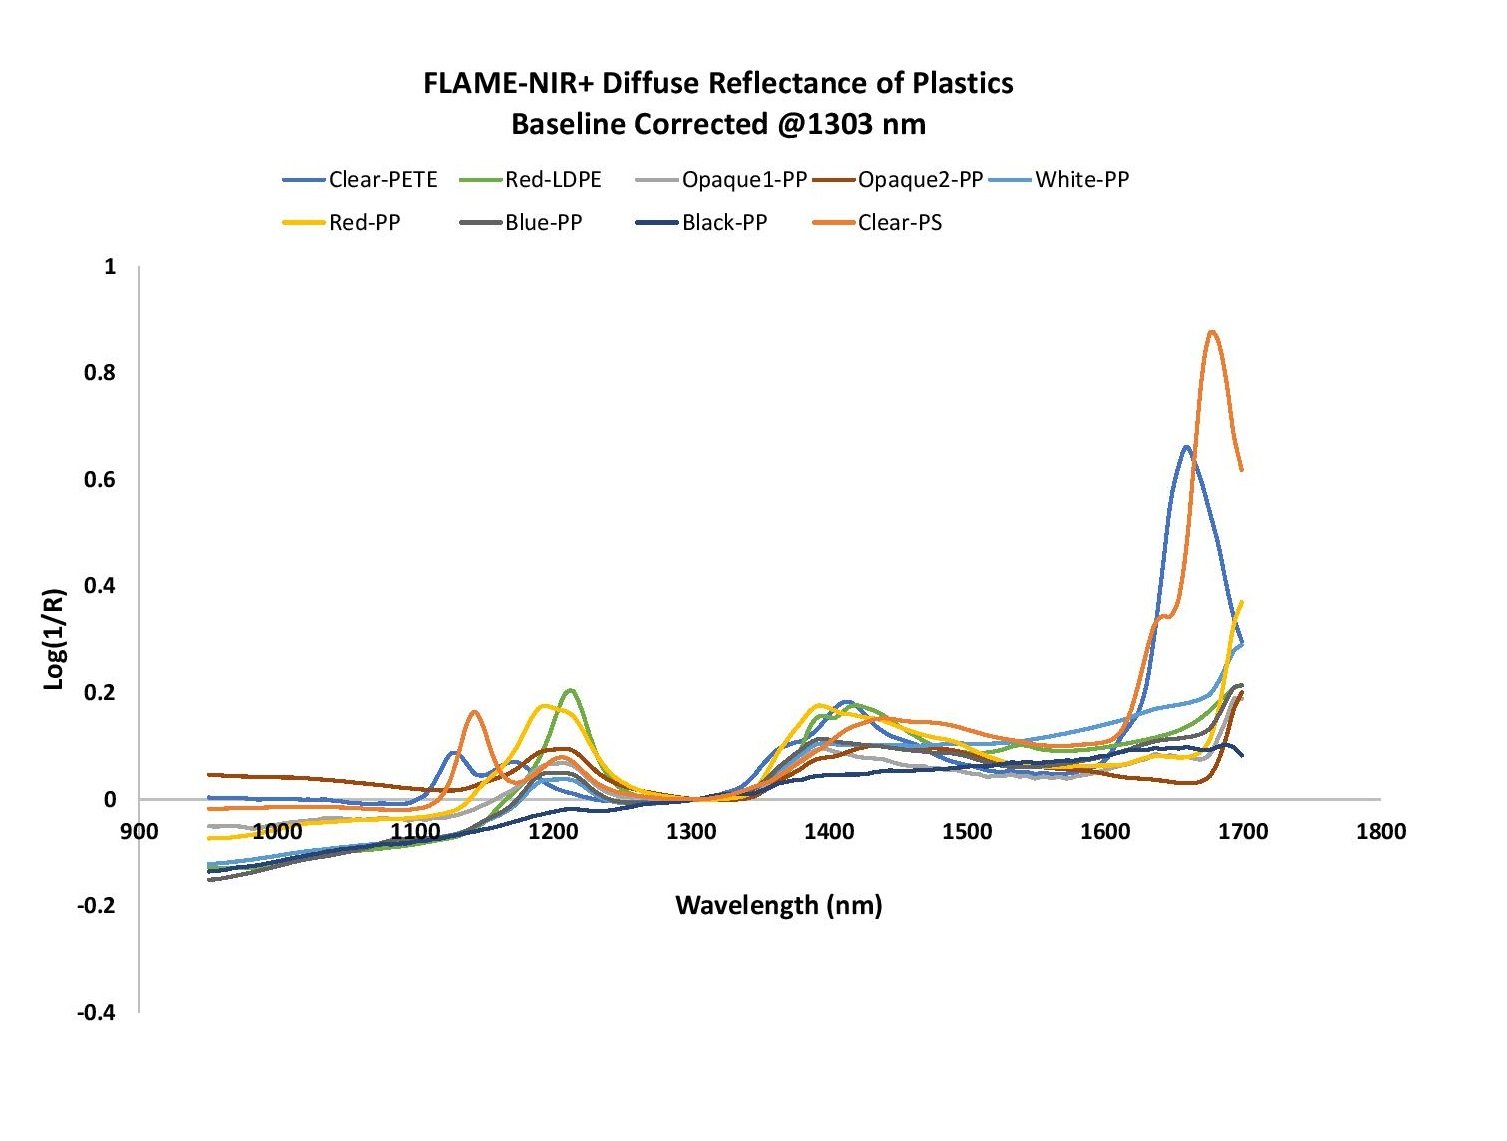
Figure 4. With baseline correction applied, diffuse reflectance spectra measured with the Flame-NIR+ spectrometer show clear differences among plastic types.
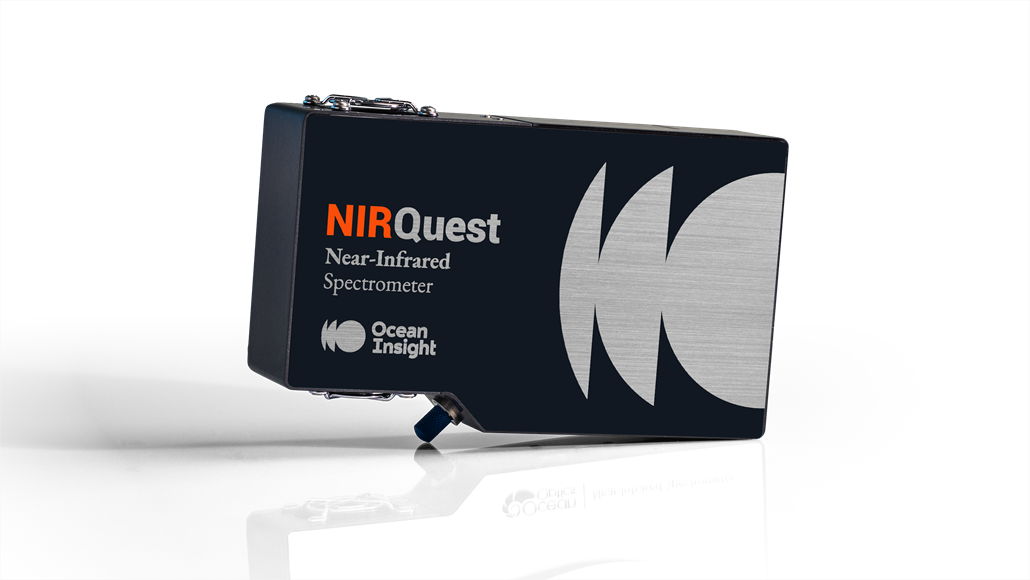
Additional measurements were performed using the NIRQuest+1.7, a thermoelectrically cooled InGaAs-array detector spectrometer with response from 900-1700 nm (Figure 5). Versions are also available with response from 900-2200 nm and from 900-2500 nm.
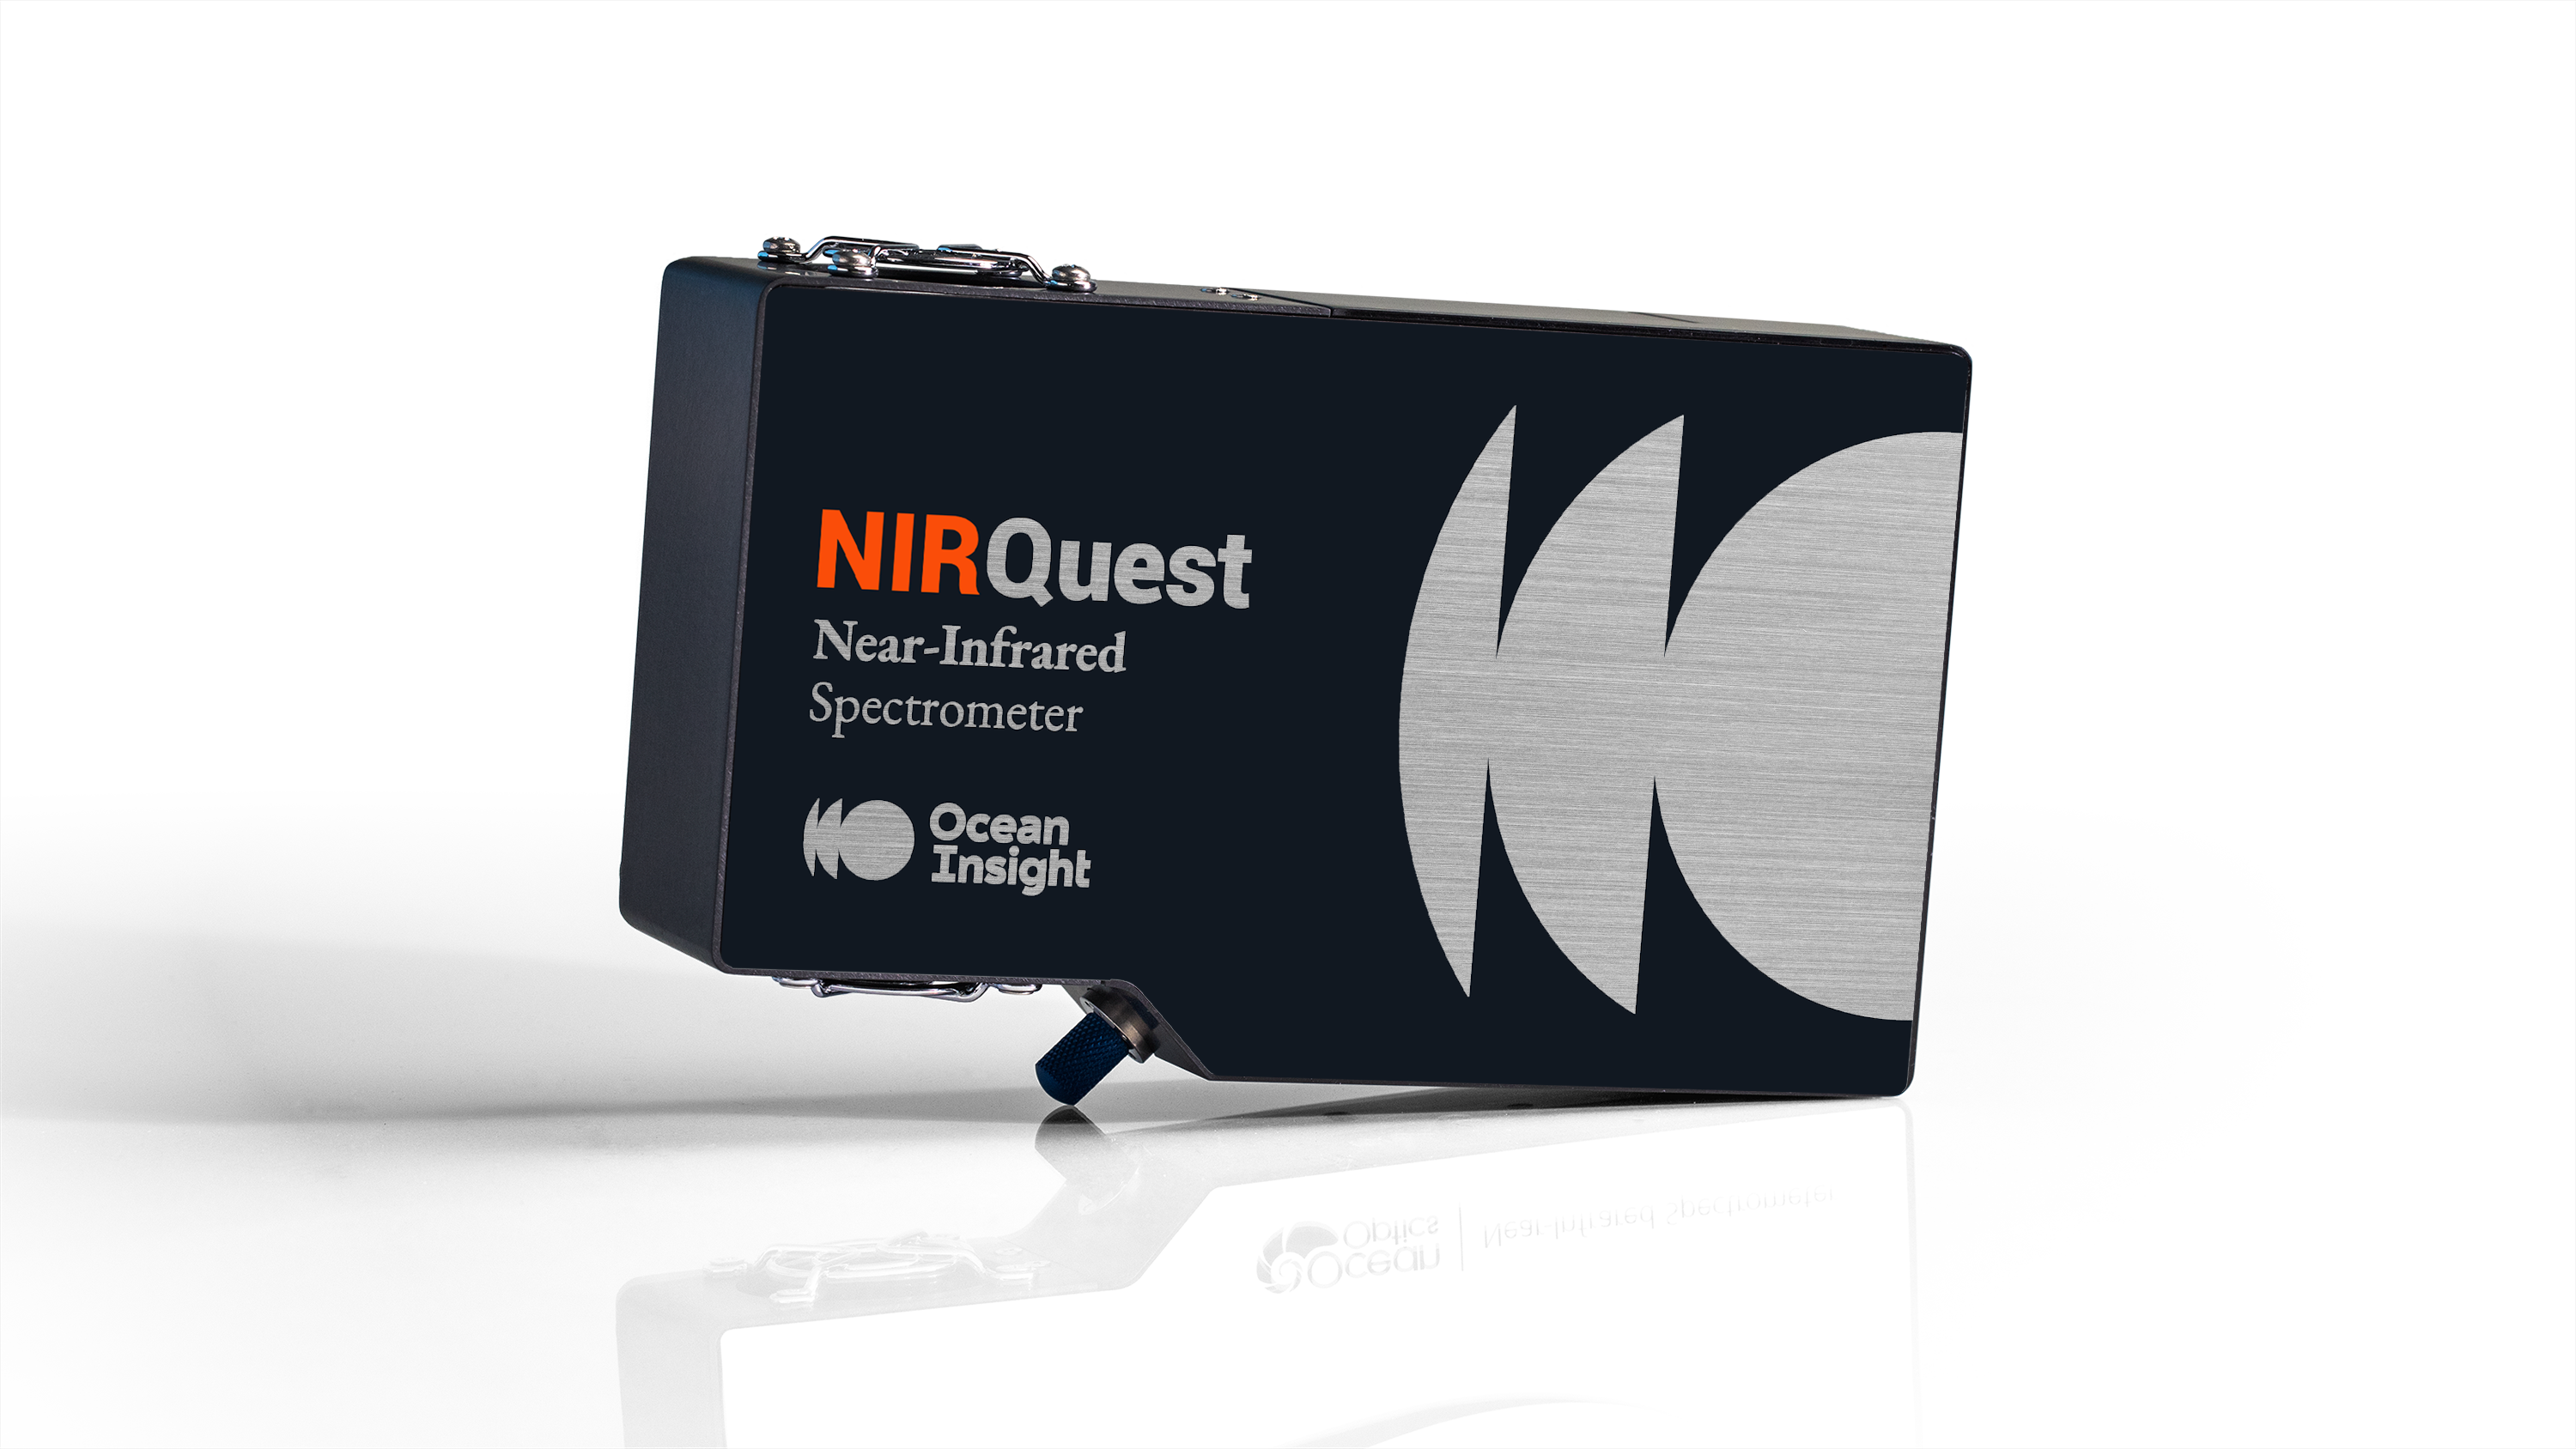
Figure 5. The NIRQuest+1.7 spectrometer (900-1700 nm) is a high-sensitivity instrument with great thermal stability, which makes it a good option for process environments.
NIRQuest+ spectrometers have an enhanced optical bench design for high-sensitivity performance, allowing for low limits of detection and cleaner spectra for diffuse reflection measurements at longer wavelengths. Compared with the Flame-NIR+, NIRQuest+ is more sensitive and offers versions with spectral response at longer NIR wavelengths (>1700 nm).
As with Flame-NIR+, we measured plastic samples (PET and PP) using a high-power tungsten halogen light source, 600 µm reflection probe and diffuse reflectance standard. We set our parameters in OceanView software at 5 ms integration time, with 25 scans to average and boxcar width set to 1. We scaled our results as %Reflection (Figure 6).
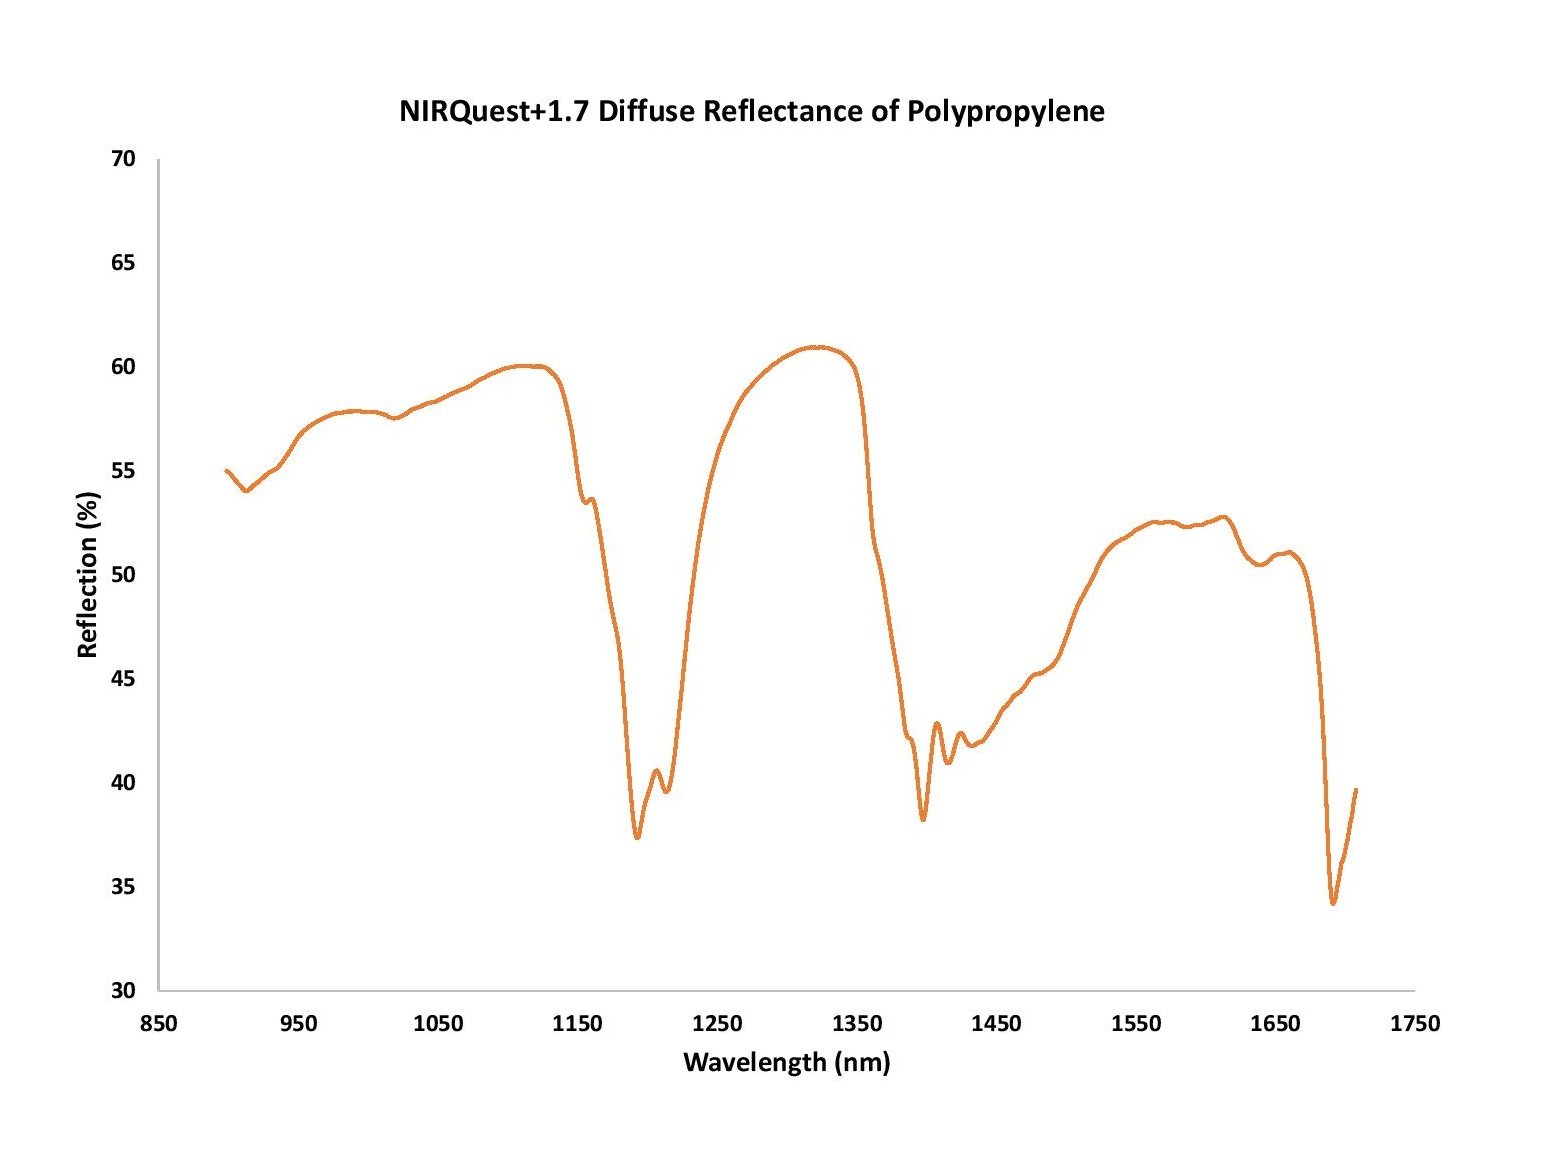
Figure 6. Diffuse reflectance of polypropylene measured with the NIRQuest+1.7 spectrometer.
With NIR spectra you build robust calibration models, but if you are trying to predict outside those calibration models, they’re not very viable. Indeed, NIR spectra provide a wealth of information about your samples, provided you have the tools to extract that data. For example, Principal Component Analysis, a chemometric analysis method, can be applied to the data collected to group and classify the samples by type using their spectral signature.
Also, for a plastics sorting process, being able to make useful decisions with your NIR reflectance spectra is a great opportunity for our Ocean Intelligence machine learning algorithms. Applied to an automated recycling sorting process, Ocean Intelligence provides another layer of insight in separating polymers more efficiently and with fewer sorting errors. Anything that isn’t sorted correctly becomes waste, which has to be recycled yet again.
With the continued evolution of NIR spectrometers and machine learning expertise, recyclers can streamline plastics-sorting processes, make operations more cost-effective, and contribute to a more sustainable environment.
Download a PDF of this application note.

1 Becker, W., Sachsenheimer, K. And Klemenz, M., “Detection of Black Plastics in the Middle Infrared Spectrum (MIR) Using Photon Up-Conversion Technique for Polymer Recycling Purposes,“ Polymers (Basel). 2017 Sep; 9(9): 435.
High-sensitivity NIR spectrometers for applications within the 900-1650 nm, 900-2120 nm and 900-2450 nm wavelength ranges

Receive updates from our team as we share application notes, customer spotlights, educational tools, spectroscopy how-to’s, and more.