Subscribe to Our Blog
Receive updates from our team as we share application notes, customer spotlights, educational tools, spectroscopy how-to’s, and more.

We describe the differences between EZ and Advanced modes in OceanView spectroscopy software, how to switch from one mode to the other, and why Advanced mode is your best bet for more intensive data processing.
Note: Please refresh your browser if you do not see any screenshots or icons in this material.
Q: What’s the difference between EZ and Advanced modes in OceanView software?
A: Options are great but can sometimes be overwhelming. So, in response to customer feedback, we updated OceanView to offer a simpler version with fewer functions. Now, in OceanView versions 2.0.8 and higher, users can switch between two modes: EZ and Advanced.
When OceanView software is first installed, the default mode is EZ. At the far left of OceanView’s title bar and to the right of “OceanView 2.0.x (Licensed) -xx,” the display shows whether the user is in EZ (EZ) or Advanced (Advance) mode.
 |
 |
Switching between modes is as simple clicking the EZ or Advanced icons in the upper toolbar. The EZ icon is simple to spot – it’s an “EZ.” The Advanced mode icon appears as silhouetted figures.
 |
The primary difference between modes is that Advanced mode has more functions (represented in OceanView by icons).
Also, the Tools menu item under File | Tools is only available in Advanced mode. That includes access to the File | Tools submenu items Combine Calibration or Raw USB.
![]()
Figure 1: These icons are associated with features available in Advanced Mode.
Here are the other differences between EZ and Advanced modes for graph features:
| Graph Manipulation | EZ Mode | Advanced Mode |
| Zoom out to maximum | x | x |
| Zoom out | x | x |
| Zoom in to graph | x | x |
| Zoom to manual selection | No | x |
| Scale graph to fill window | x | x |
| Scale graph height to fill window | No | x |
| Manually set numeric ranges | No | x |
| Toggle graph panning mode | x | x |
| Graph Input/Output | EZ Mode | Advanced Mode |
| Copy data to clipboard | x | x |
| Save graph to files | x | x |
| Load ASCII file to graph | No | x |
| Configure graph saving | x | x |
| Print graph | x | x |
| Convert active spectrum to overlay | No | x |
| Delete overlay spectrum | No | x |
| Graph Specialty Features | EZ Mode | Advanced Mode |
| View results in table form | x | x |
| Reference spectrum | No | x |
| Background spectrum | No | x |
| Create strip chart | No | x |
| Splice data | No | x |
| View spectrum peaks | No | x |
| View trendline time trail | No | x |
Options available
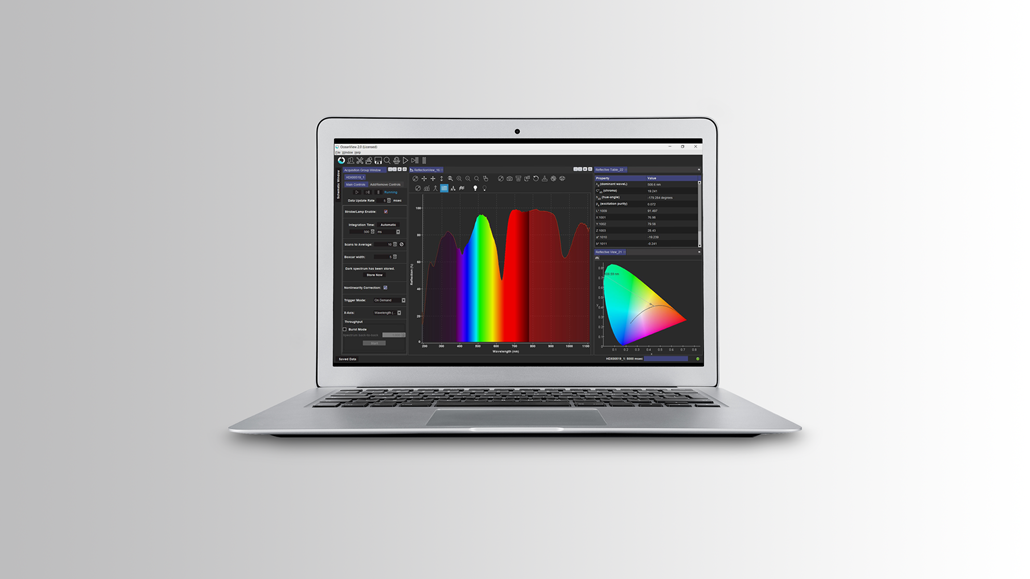
OceanView 2.0 is a smooth and powerful new version of our flagship spectroscopy application. The software runs on Windows, Mac OS and Linux, and controls Ocean Insight spectrometers.
Prices From $305.00
Options available
OceanDirect is a powerful device driver platform with API for control of Ocean Insight spectrometers.
Prices From $625.00
Experts Yvette Mattley and Derek Guenther guide listeners on a tour of OceanView 2.0 software.
The second part of OceanView 2.0 Webinar Series covers The Wizard and the Power of the Schematic.
The last video answers some of the pressing questions from our customers. Thank You!

Visit our FAQs section for simple, straightforward answers to your most common questions about Ocean Optics products, measurements and software.

Receive updates from our team as we share application notes, customer spotlights, educational tools, spectroscopy how-to’s, and more.