Subscribe to Our Blog
Receive updates from our team as we share application notes, customer spotlights, educational tools, spectroscopy how-to’s, and more.
In this post, we share spectra that demonstrate how the high optical resolution performance and balanced (or “flatter”) spectral response of the new Ocean SR2 spectrometer mitigate typical performance trade-offs.
Although distinguished by its high-speed spectral acquisition and superior signal to noise ratio (SNR) performance, Ocean SR2 also provides high resolution and balanced spectral response across UV, Visible and Shortwave NIR wavelengths. Here are some spectra that help illustrate those features.
Thanks to its enhanced optical bench design, Ocean SR2 can be configured for optical resolution as favorable as 0.43 nm (FWHM). This is ideal for applications including analysis of emission lines in gases and plasmas and characterization of LEDs and high intensity light sources.
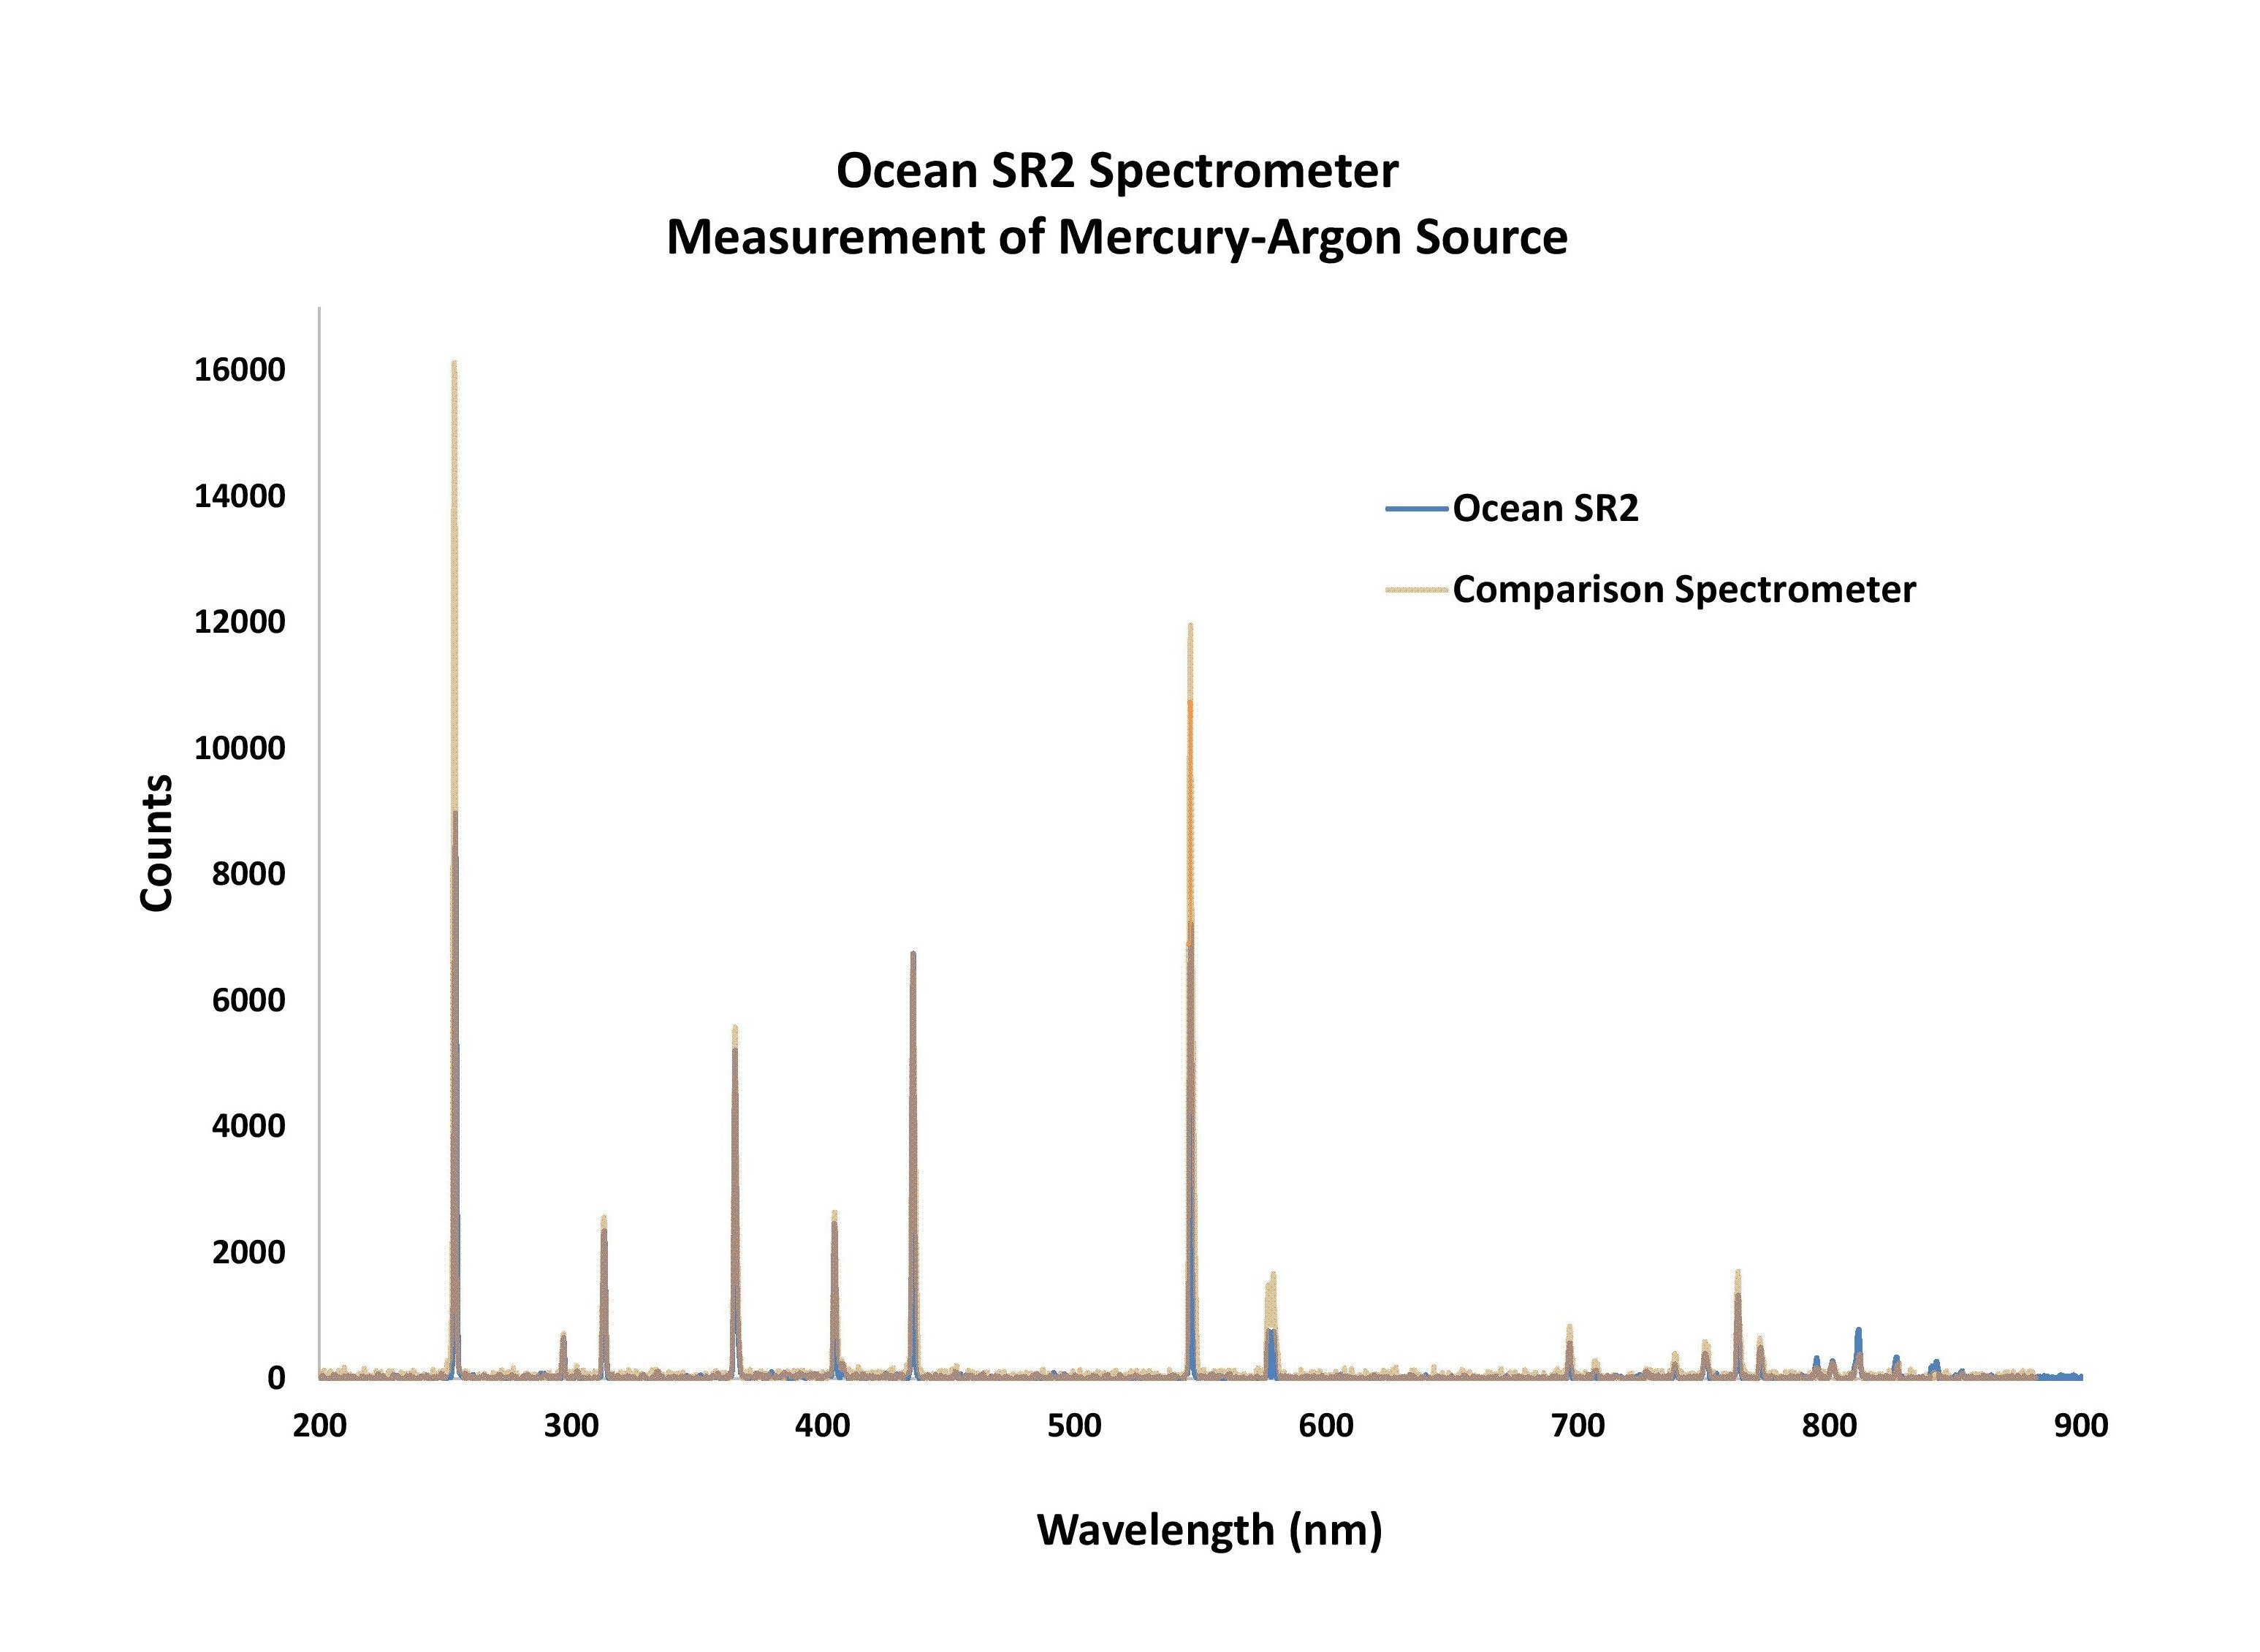 Figure 1. When compared with a spectrometer of similar design and price level, Ocean SR2 demonstrated higher resolution performance.
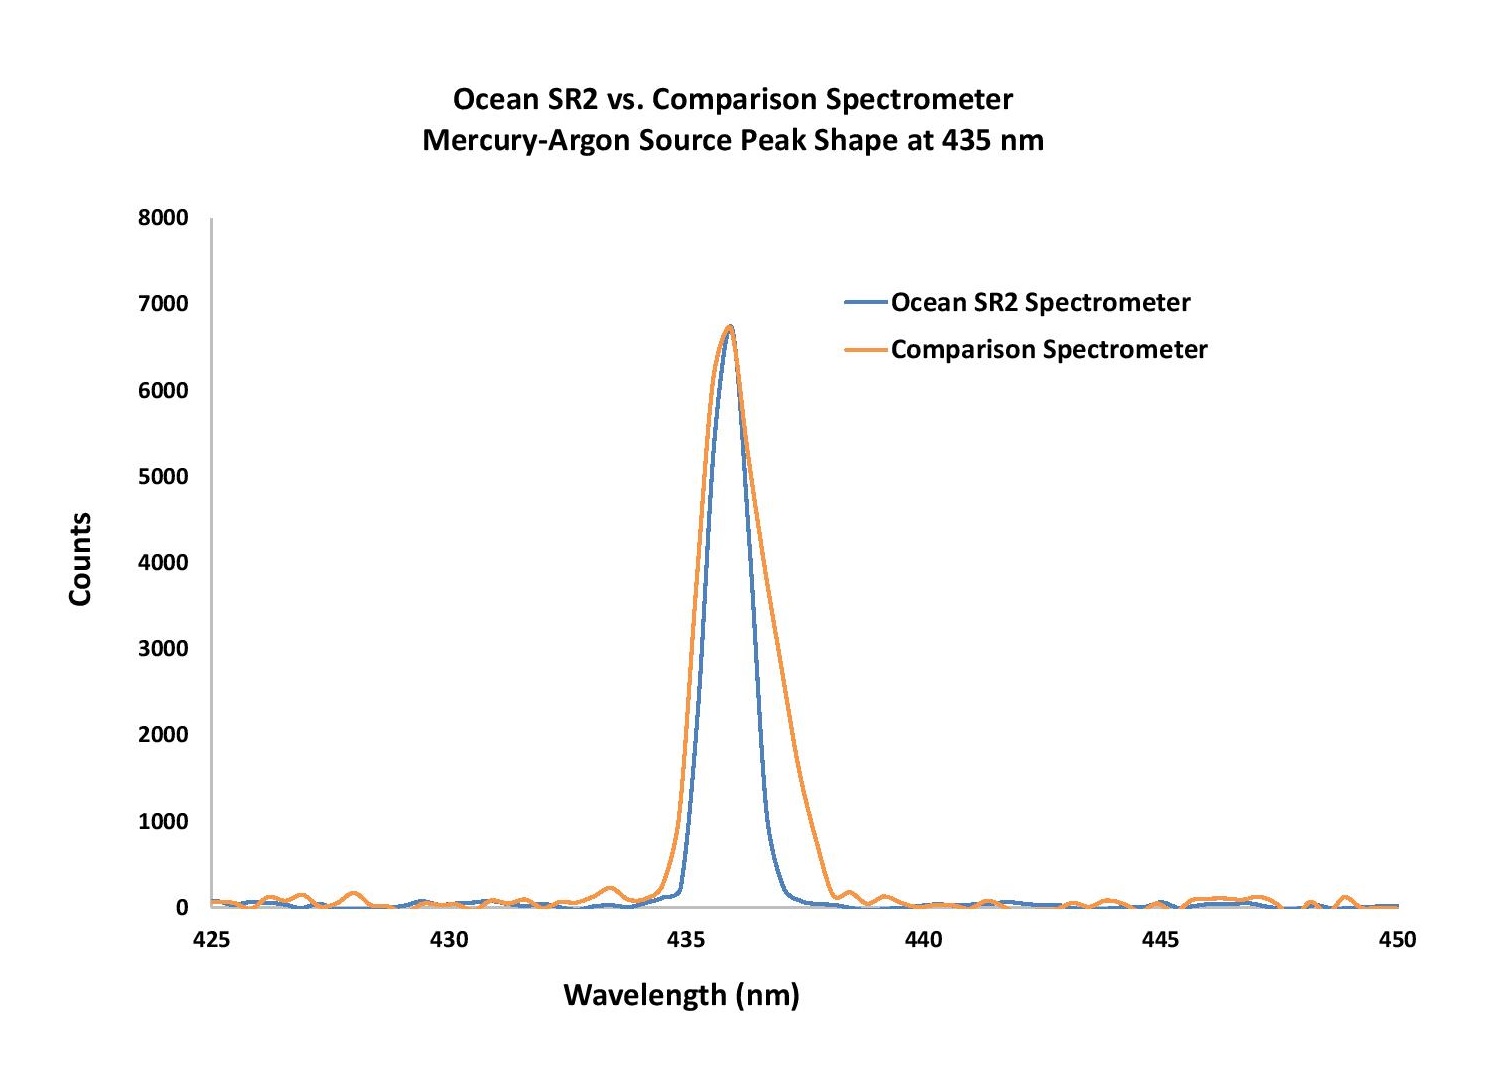
Figure 2. Zooming into Figure 1’s peak shape near 435 nm shows comparable optical resolution for both spectrometers. The difference is that Ocean SR2 achieves its resolution with a 50 µm slit while the comparison spectrometer requires a narrower, 25 µm slit, thus sacrificing throughput.
With Ocean SR2, a more balanced spectrum across the wavelength range means that the user won’t need to saturate some parts of the spectrum to get enough signal in another. With some setups, there can be high sensitivity in one region of the spectrum and lower signal levels in another region. Steps you take to increase signal in less sensitive regions – like increasing spectrometer integration time – can translate to more noise across those wavelengths and lead to saturation at wavelengths where sensitivity is already high.
However, if the response is flatter across the spectrum, then the integration time can be increased – provided you have sufficient light intensity – and SNR improves.
For example, in absorbance measurements, you take a dark, then a reference, then a sample measurement. Essentially, you are comparing the reference to the sample. If both reference and sample measurements have good signal then your result has a much better level of certainty than if both are relatively weak signals, as the SNR will be greater.
Ultimately, with the relatively balanced sensitivity of Ocean SR2, you will achieve more consistent performance across the entire wavelength range of the spectrometer.
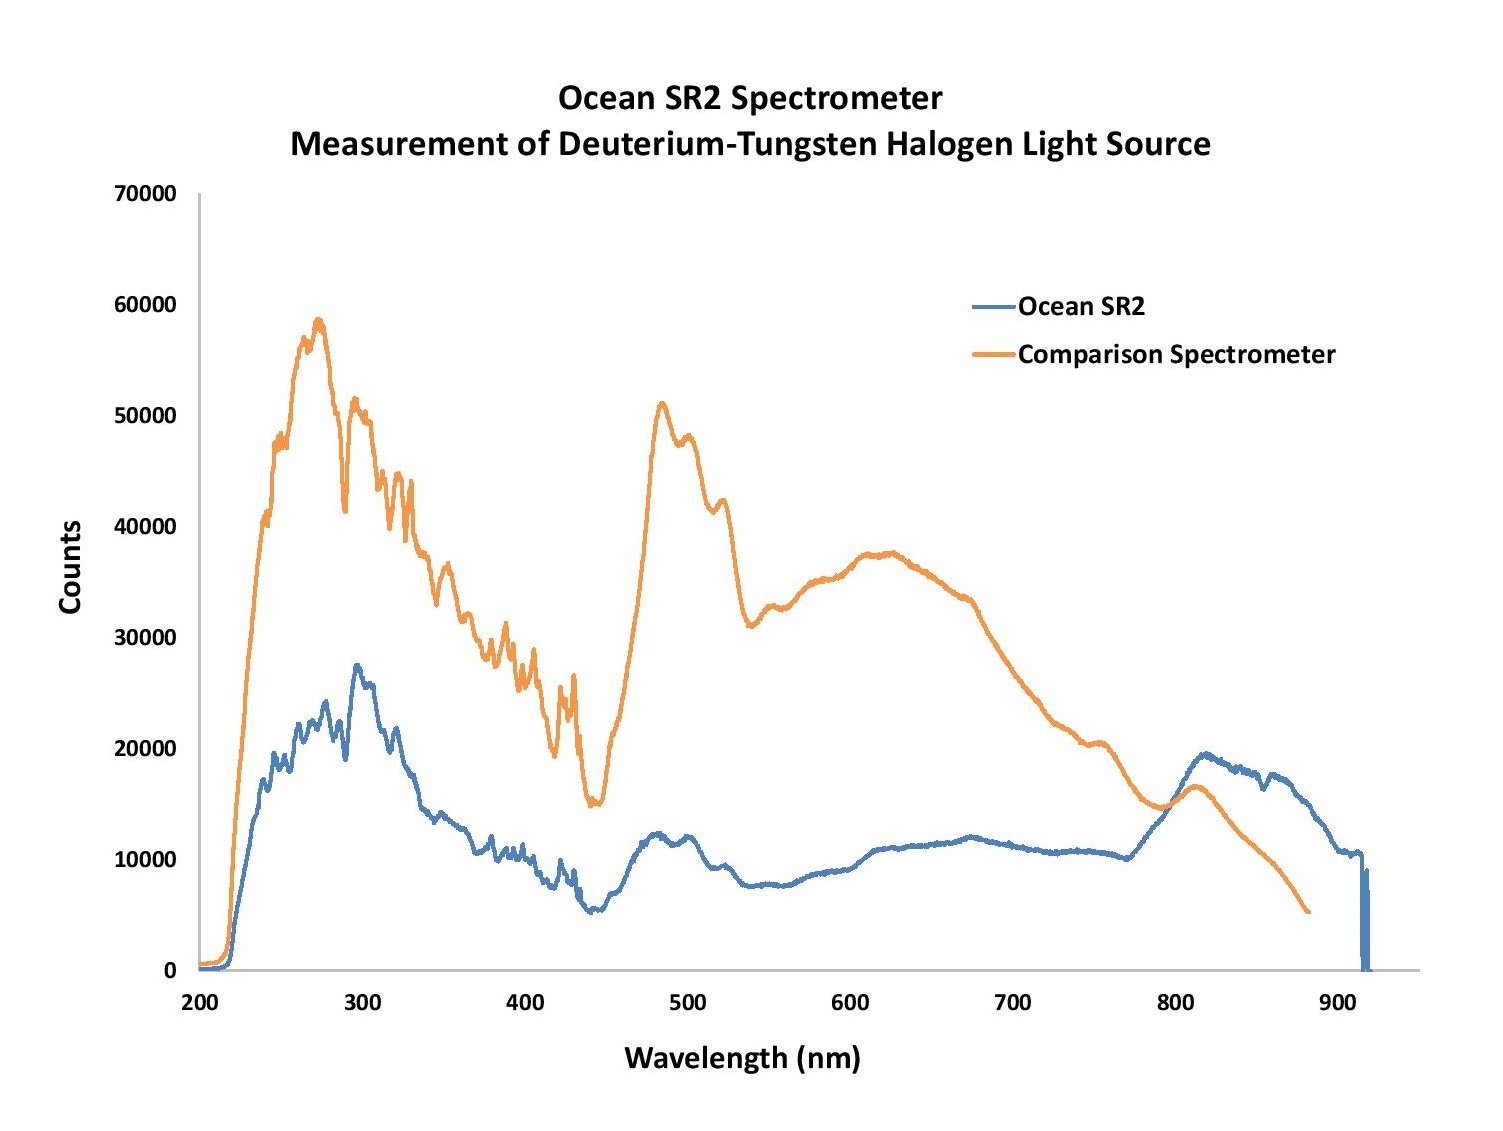
Figure 3. These spectra demonstrate the more balanced response of Ocean SR2. At ~250 nm, the comparison spectrometer is close to saturating, which will limit the integration time possible and yield a lower response throughout the rest of the spectral range. With Ocean SR2, the spectrum is much more balanced across the spectral range, adding flexibility in optimizing measurement parameters.
Compact spectrometers offer rapid acquisition and high SNR for high light level applications including LED/laser characterization.1
Compact spectrometer offers rapid acquisition and high SNR for high light level applications including LED/laser characterization.
In this video, we showcase key features of our exciting new Ocean SR2 spectrometer. The SR2 is distinguished by its high-speed spectral acquisition and low stray light.
Learn how effectively the Ocean SR2 spectrometer performs when measuring the absorbance of optical filters and potassium dichromate solution standards.

Receive updates from our team as we share application notes, customer spotlights, educational tools, spectroscopy how-to’s, and more.