Subscribe to Our Blog
Receive updates from our team as we share application notes, customer spotlights, educational tools, spectroscopy how-to’s, and more.
The modular nature of Ocean Insight spectrometer systems allows for great flexibility in benchtop laboratory measurement, whilst also making our setups ideal for integration into process lines.
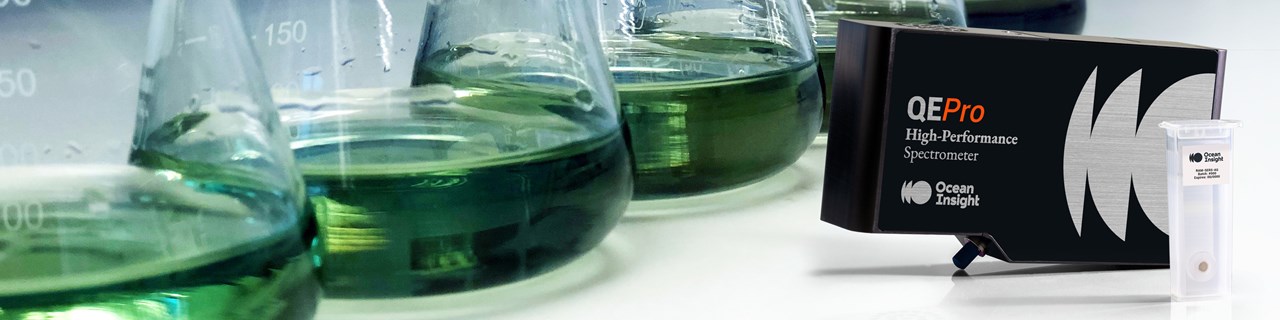
The strength of the Ocean Insight offering is highlighted by the quality of the QE Pro spectrometer platform. The QE Pro is our flagship spectrometer, a back-thinned CCD array model that offers the signal to noise, dynamic range and sensitivity required of Raman and low light level applications.
The new QE Pro-Raman+ has elevated QE Pro performance to another level, in a configuration suitable for 785 nm Raman excitation spectroscopy. With increased sensitivity and expanded spectral range, QE Pro-Raman+ reaches even the most elusive Raman spectra in challenging applications.
To demonstrate key performance improvements in the QE Pro-Raman+, we compared it to the previous version of the spectrometer over a series of Raman measurements.
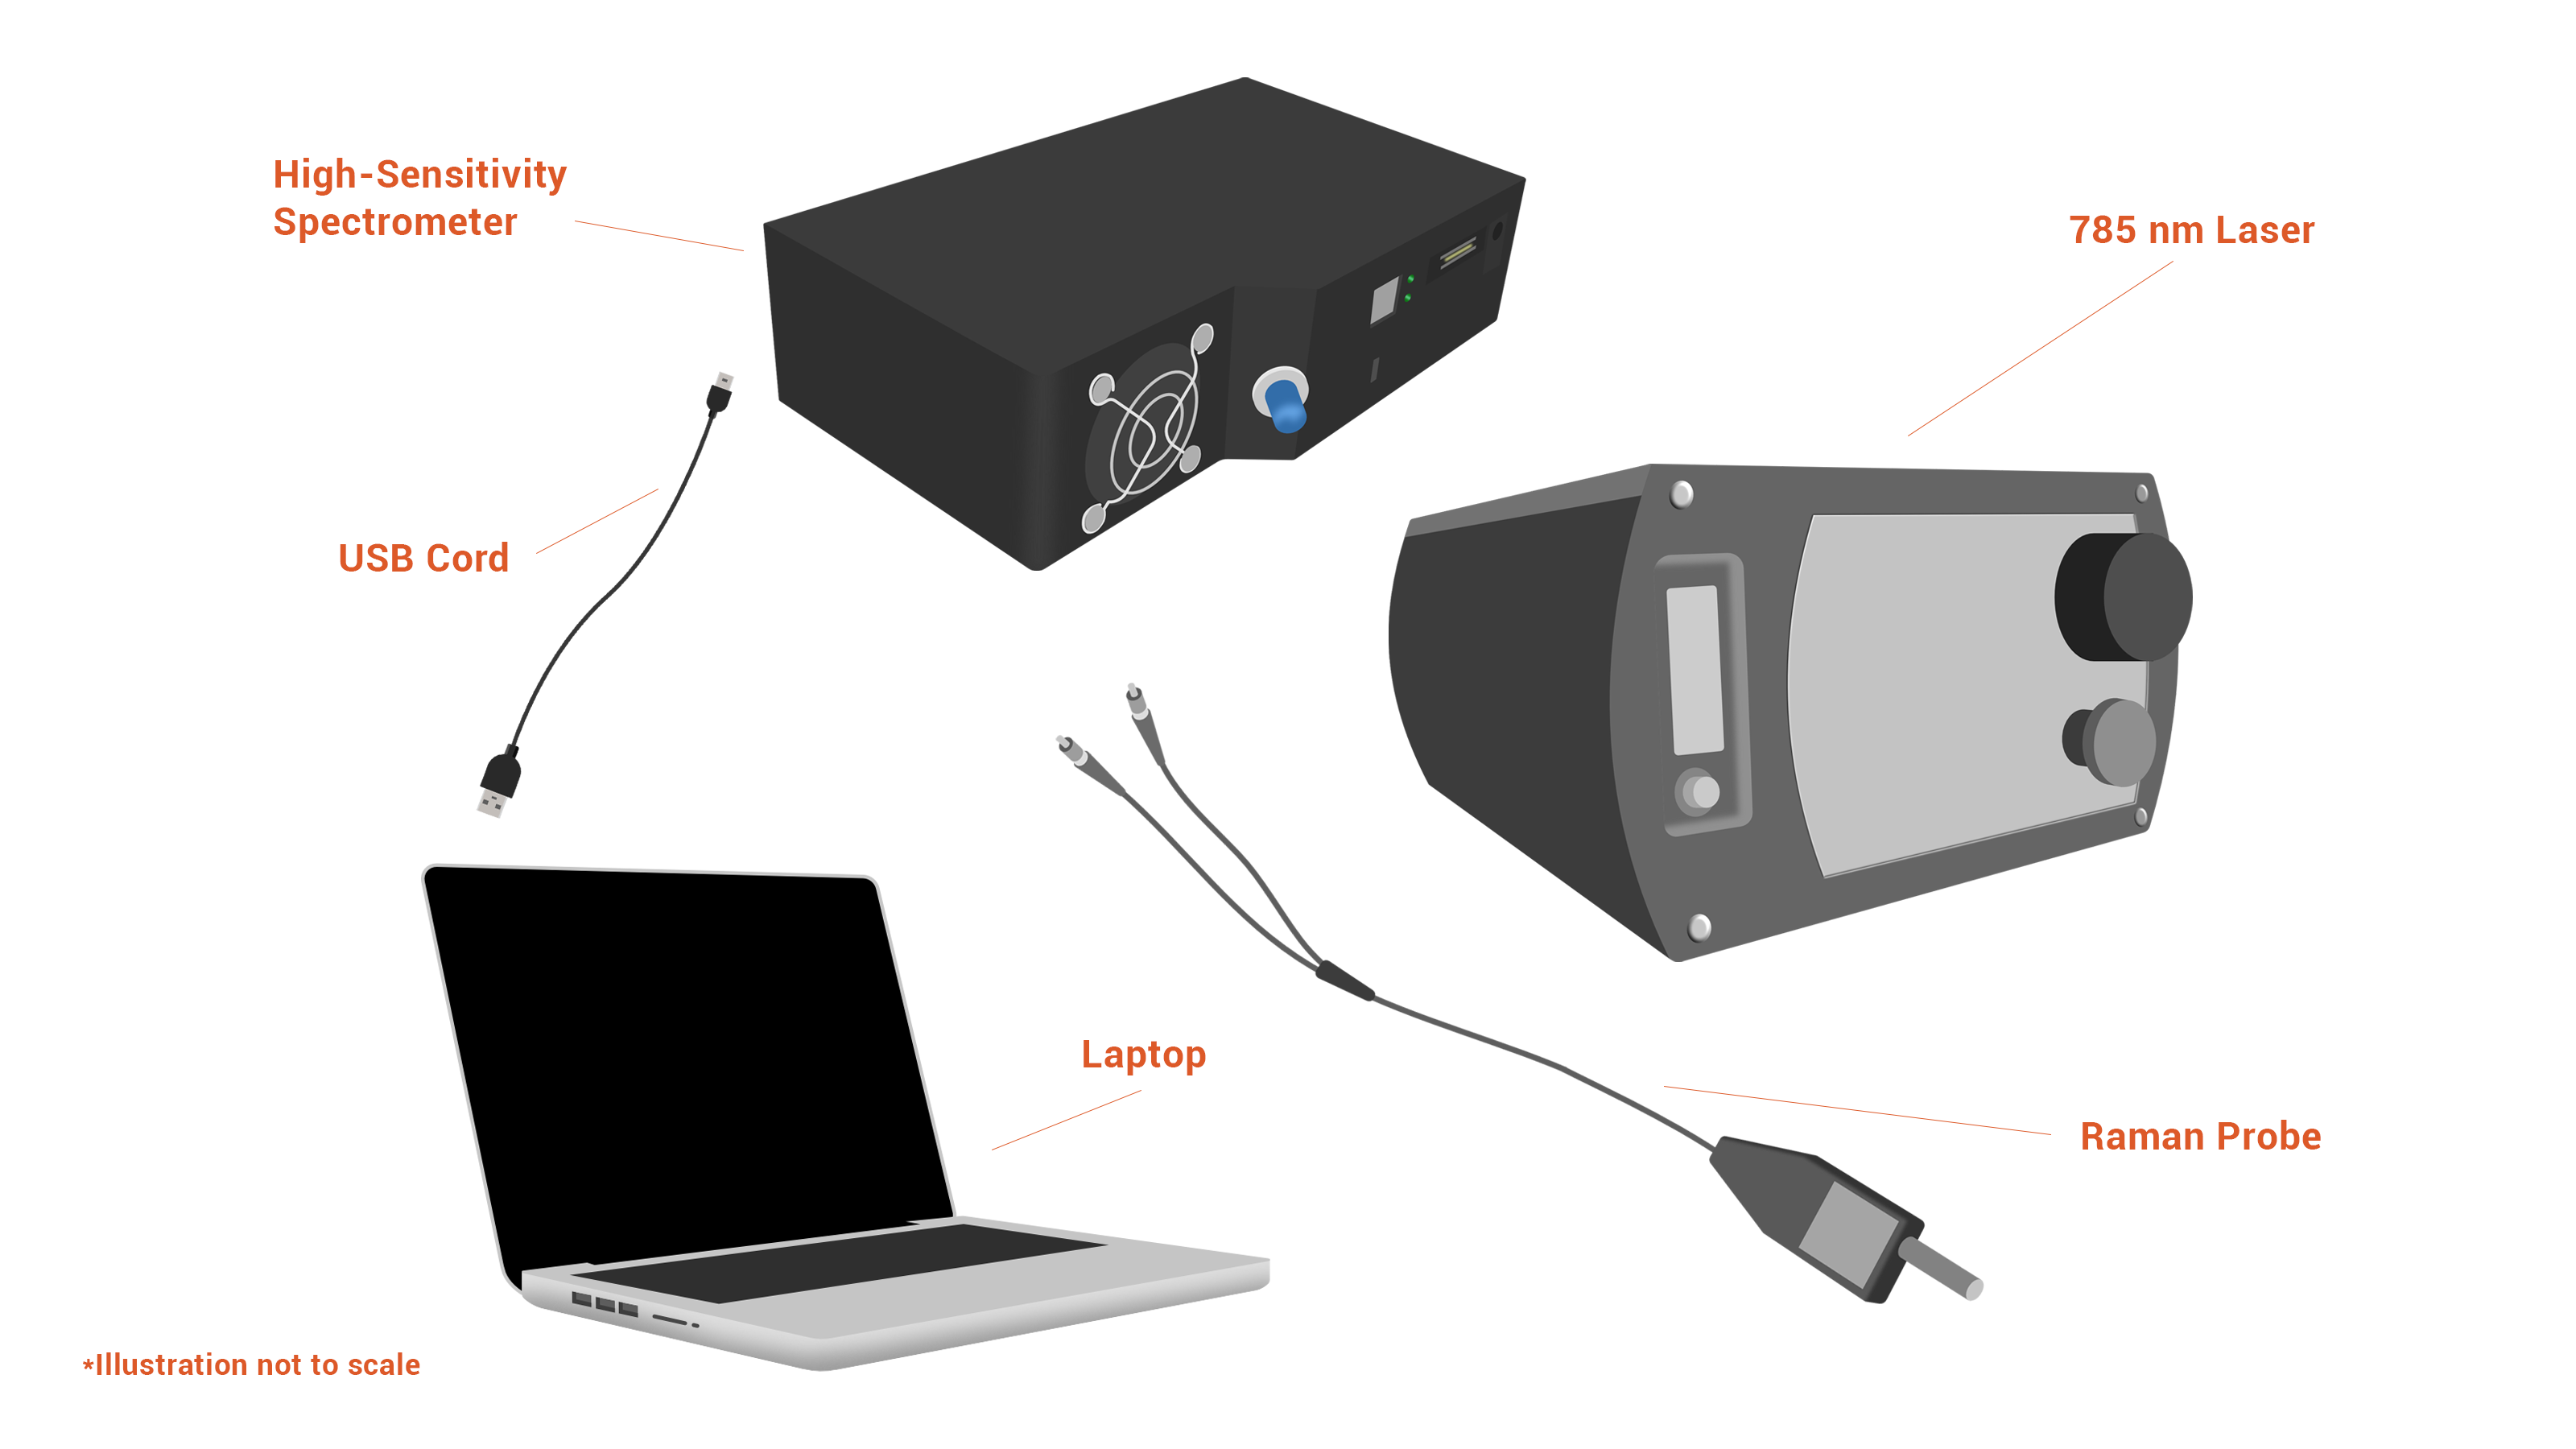
Here are the components comprising our modular Raman system. Figure 1 shows the setup.
To demonstrate the improved performance of the QE Pro-Raman+, we measured a series of organic solvents. Organic solvents typically have strong and repeatable Raman scattering characteristics, so they work very well as standards against which to compare system performance parameters.
Measurements were performed in OceanView software, applying a 1 second integration time and a single scan to average. The CleanPeaks function was applied to flatten the baseline of the resulting spectra. CleanPeaks is a built-in algorithm that can be applied to raw Raman spectra to remove the baseline and any fluorescence.
The results for acetone, isopropanol and methanol are shown in Figure 2.
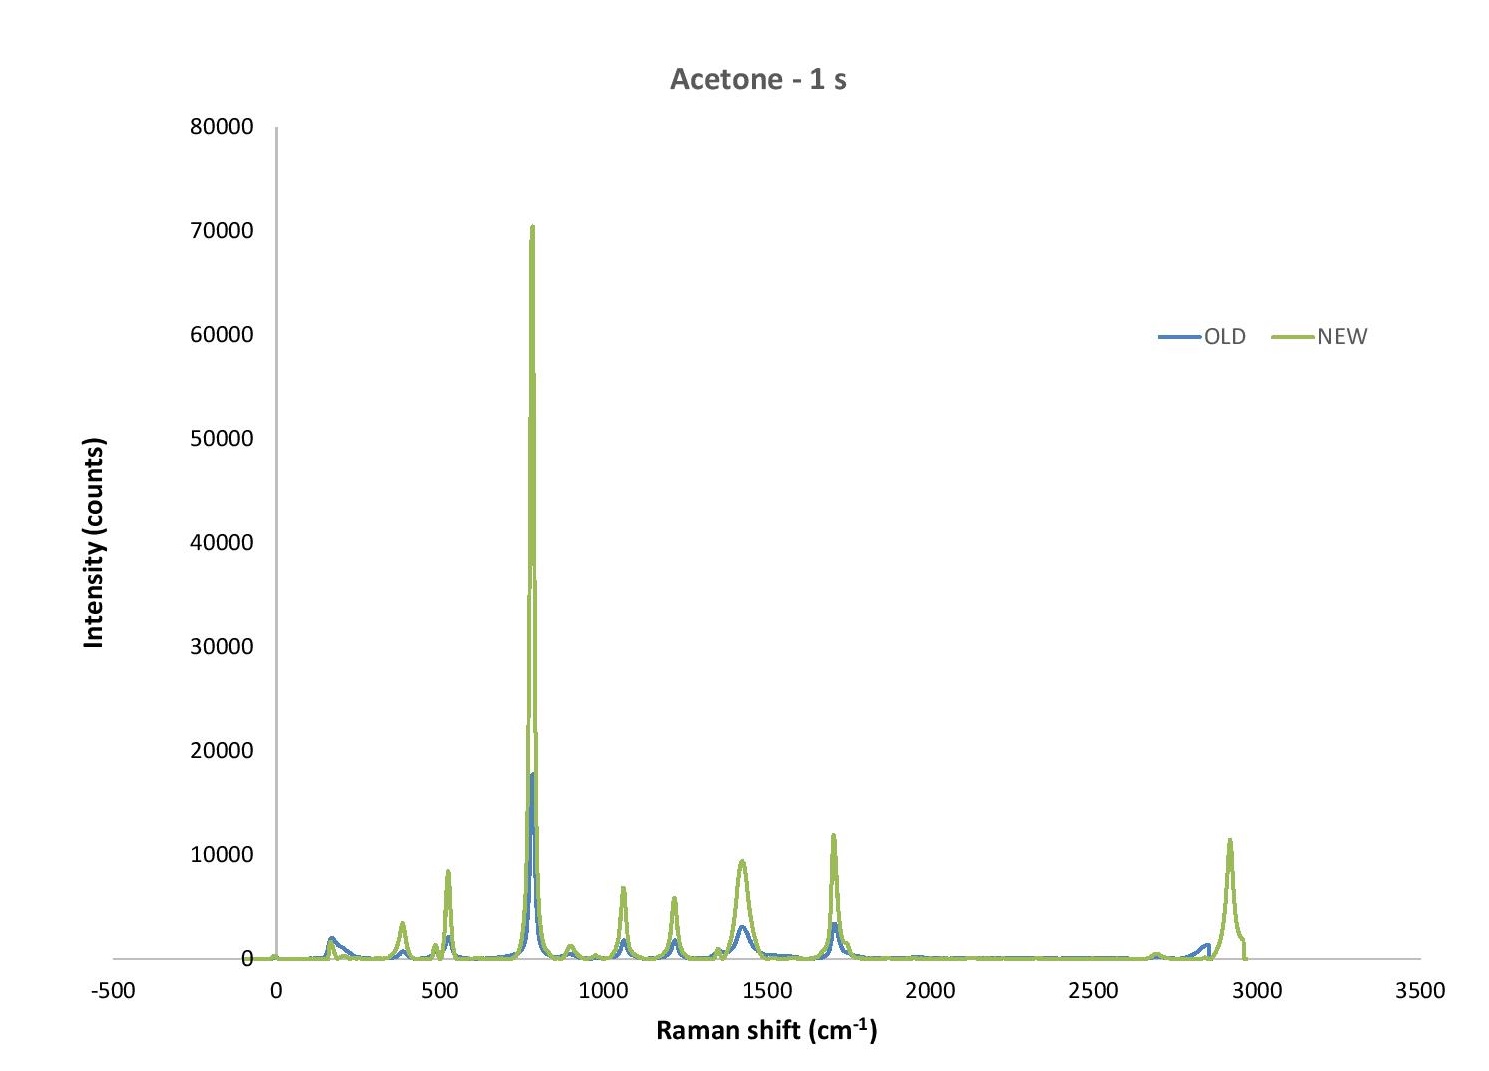
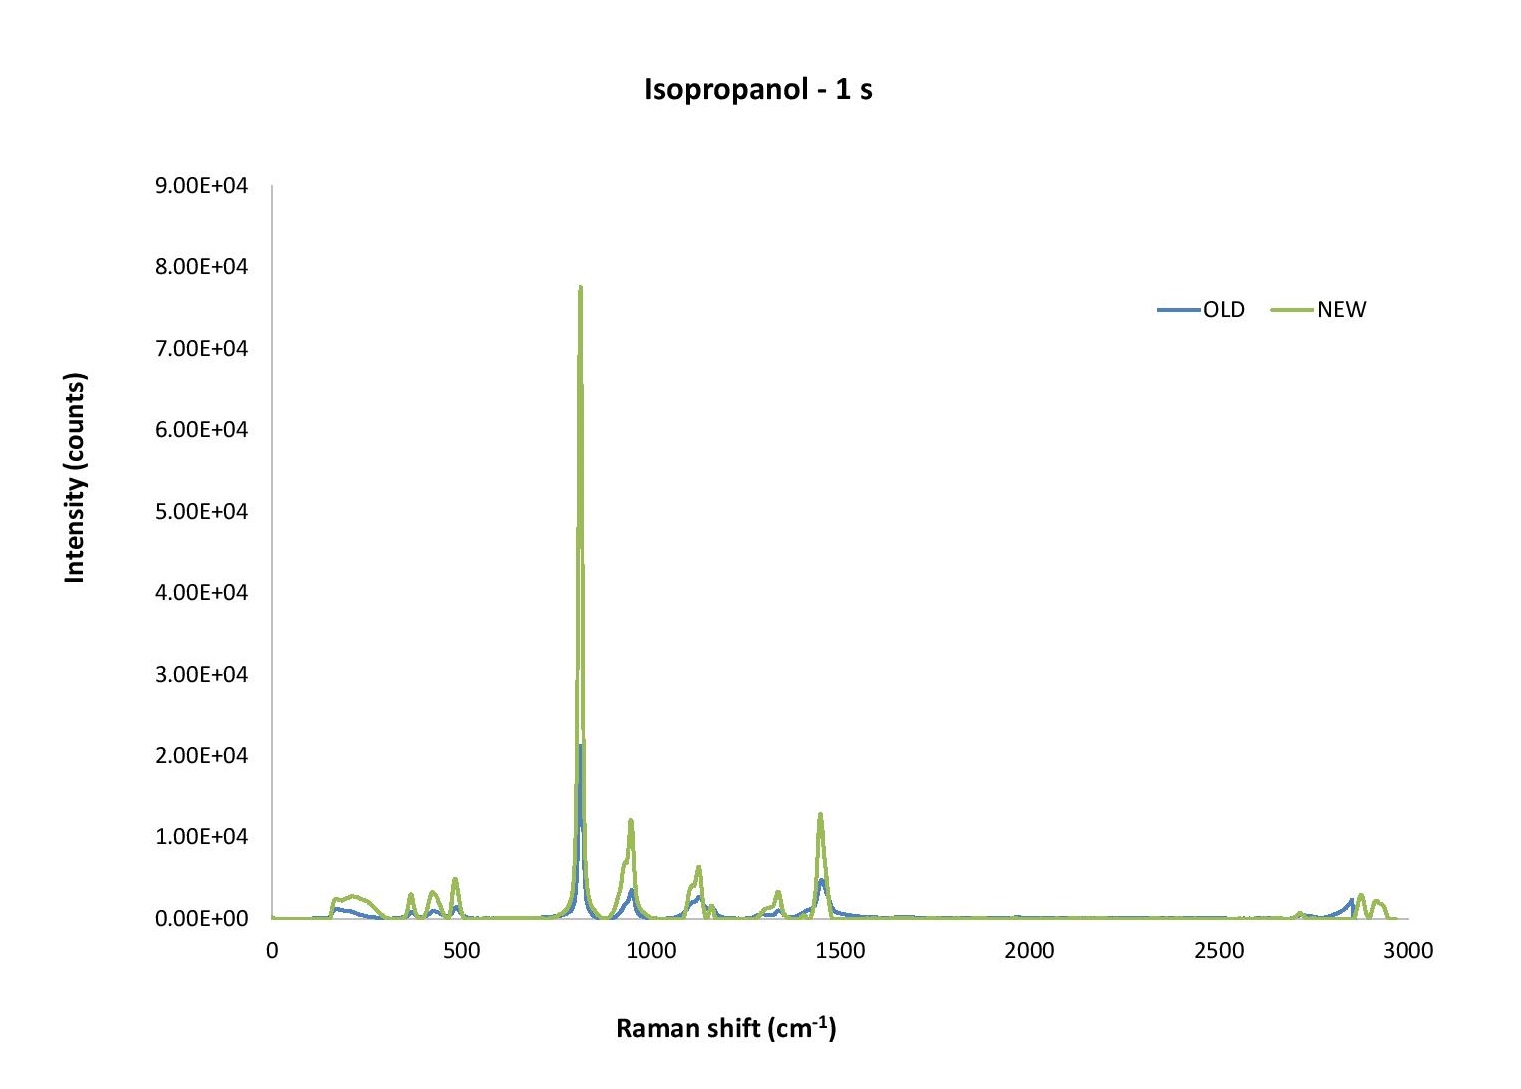
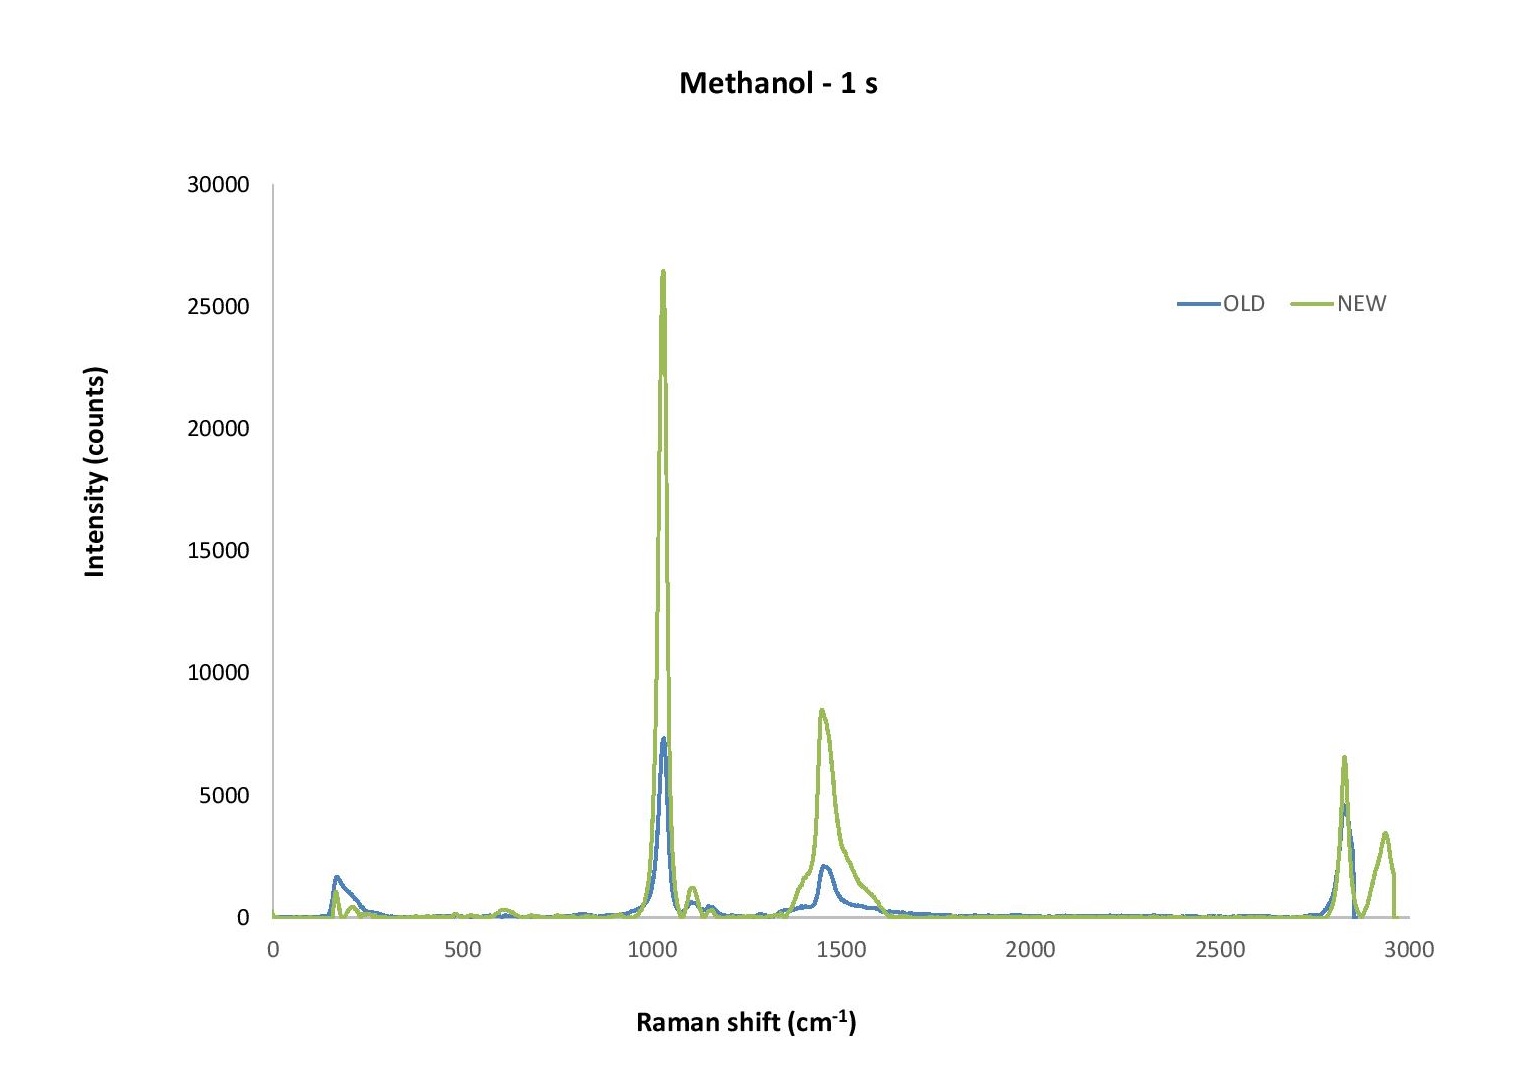
Figure 2. Comparison between the QE Pro-Raman and the QE Pro-Raman+ for common solvents at a 1 second integration time. The increased sensitivity of the QE Pro-Raman+ is clear as well as the benefit of its slightly increased range, with peaks around 3000 cm-1 featuring strongly in the spectra.
For our next set of measurements, we took 6 QE Pro-Raman+ spectrometers and measured a sample of cyclohexane, with all other system components remaining the same. The integration time in every case was 1 second. This provided insight into the spread of sensitivities that can be expected across multiple instruments.
The resulting graph (Figure 3) demonstrates that while not all spectrometers are identical in performance, the quality of results is highly consistent. This manufacturing consistency is one reason the QE Pro platform has been so popular with our solutions partners.
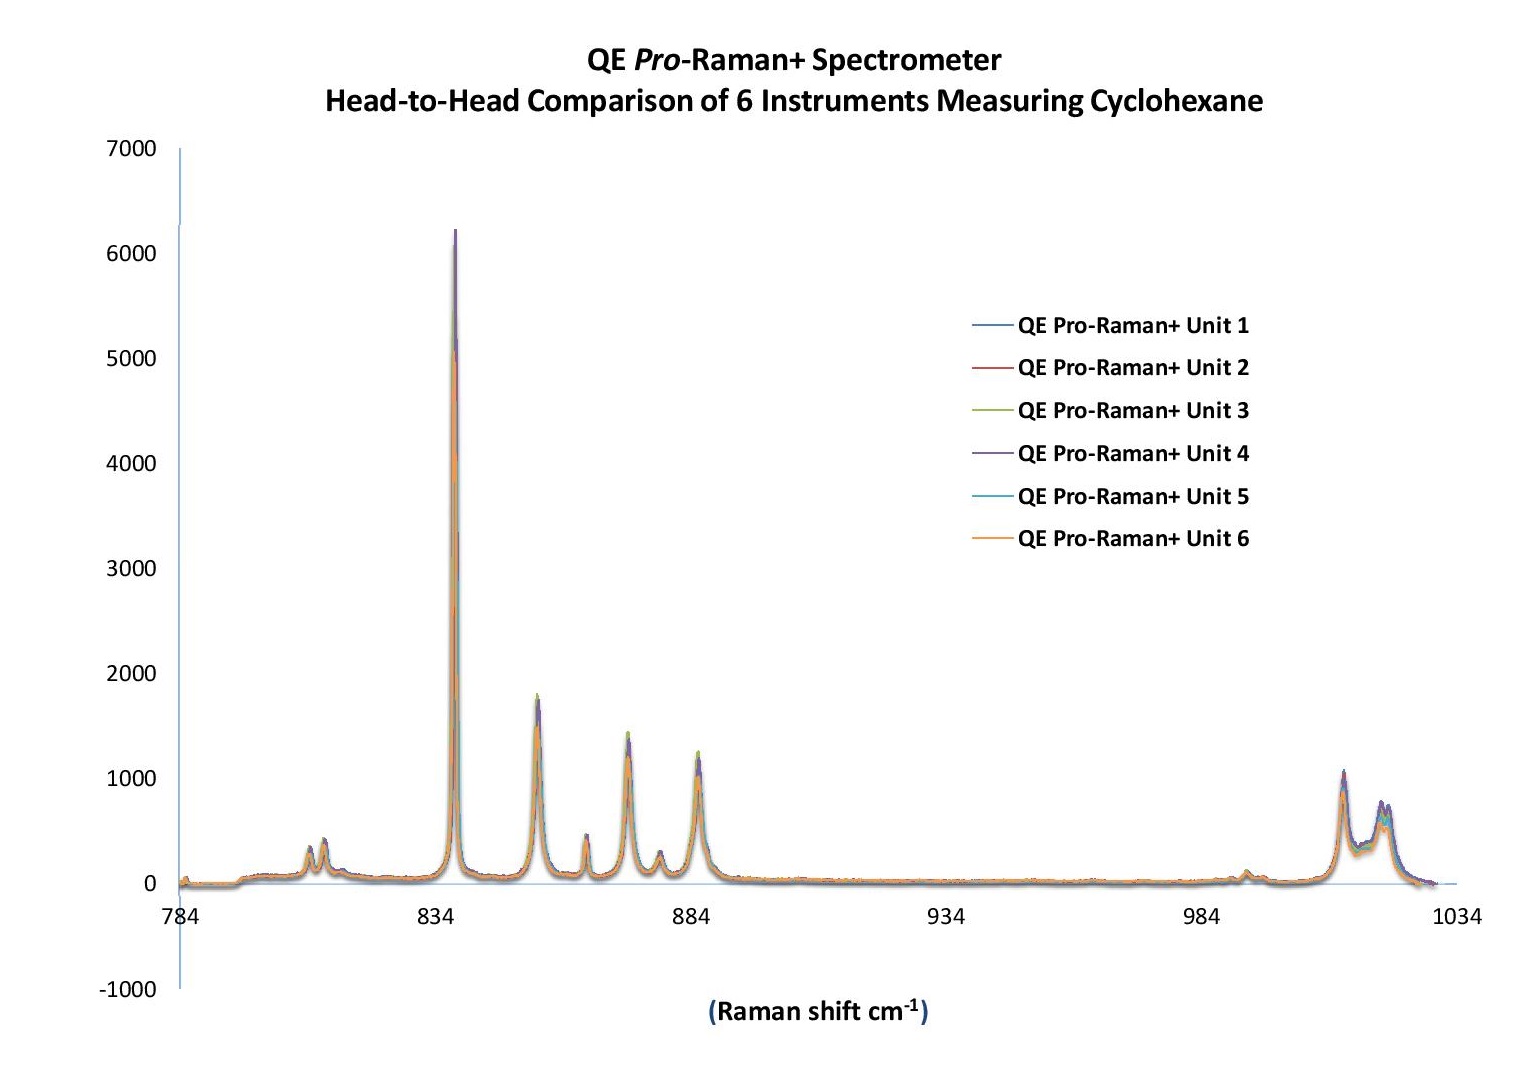
Figure 3. As these results demonstrate, the QE Pro-Raman+ offers a high degree of unit-to-unit consistency.
Having demonstrated the improved performance of the QE Pro-Raman+, we used our next set of measurements to add some application context.
Through years of dedicated effort and refinements, Ocean Insight has developed an impressive portfolio of SERS substrates and chemistries. To test their effectiveness when combined with the QE Pro-Raman+, we used a SERS gold nanoparticle colloid to detect trace amounts of the fungicide thiram.
We added 40 uL of 1 ppm thiram to 1 mL liquid SERS. This concentration was determined as relevant from tolerances established by the U.S. Code of Federal Regulations for residues of the fungicide thiram (tetramethyl thiuram disulfide) in or on raw agricultural commodities as follows:
|
Commodity |
Parts per million |
|
Apple |
7.0 |
|
Banana |
0.8 |
|
Peach |
7.0 |
|
Strawberry |
7.0 |
The resulting SERS spectra (Figure 4) clearly demonstrated that thiram at 1 ppm concentration was well within detection limits. It is also evident from the comparison between the QE Pro-Raman and the QE Pro-Raman+ that limits of detection would be significantly lower for the newer spectrometer.
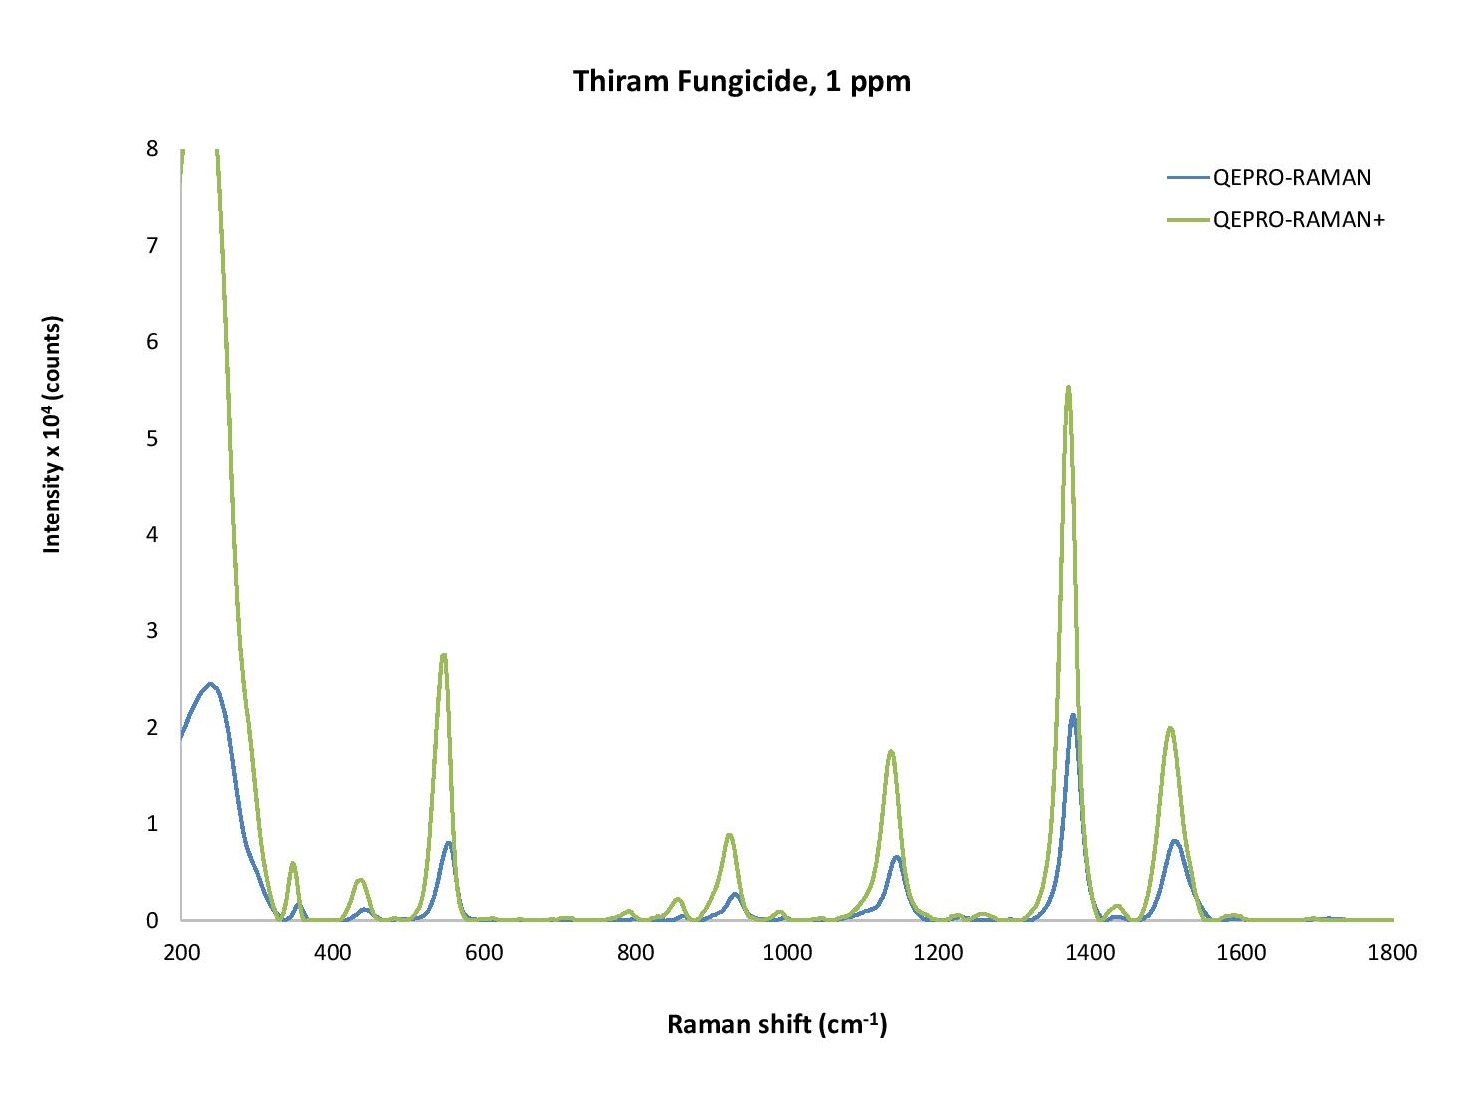
Figure 4. After adding SERS gold nanoparticles to our thiram measurement setup, the sensitivity improvement with QE Pro-Raman+ is even more pronounced.
Increased sensitivity relative to earlier configurations of the QE Pro spectrometer was clearly and consistently demonstrated in the QE Pro-Raman+. The importance of increased sensitivity is evident in LOD (limits of detection) studies, since the signal will remain detectable over the noise floor at ever diminished concentrations.

Receive updates from our team as we share application notes, customer spotlights, educational tools, spectroscopy how-to’s, and more.